Morphology Analysis Measurements
This topic defines measurements that are available in Image Studio Morphology Analysis.
First, it is important to understand contours.
-
The term contour refers to the boundary around objects in the image. The contour separates the object being measured from the image background. Objects can be spheroids, organoids, bacterial colonies, etc.
-
Image Studio identifies objects and draws contours based on pixel intensity thresholds set by the researcher (in Custom Thresholds) or by using an adaptive thresholding algorithm (in Auto Detection).
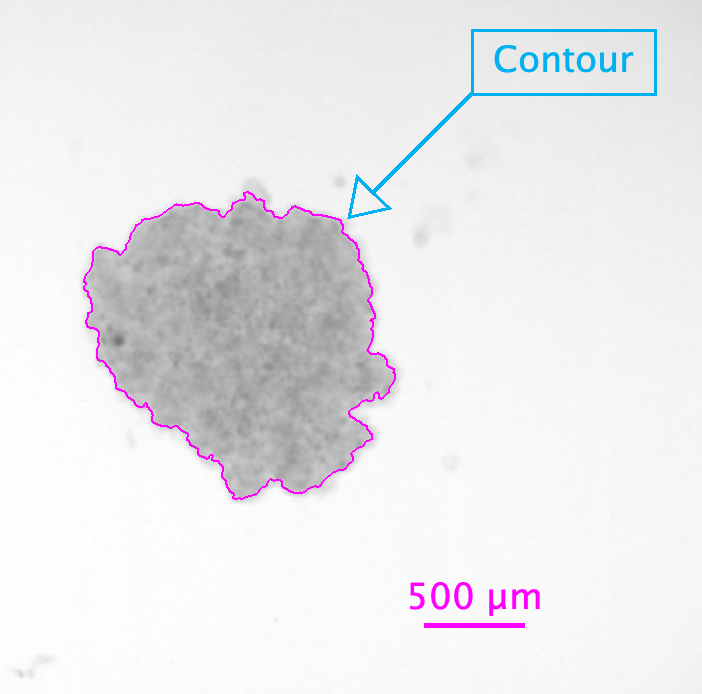
This screenshot shows an automatically generated contour that Image Studio has drawn around a spheroid.
Measurements
To change which measurements are displayed in the Morphology Shapes table, click Columns  and select the measurements that you want to see.
Data can be converted from pixels to physical units and exported using the Export Summary Data button on the Morphology Analysis ribbon. Supported physical units are mm, um, and cm. Conversions are based on the instrument's precise, resolution-dependent pixel size.
You can filter the Morphology Shapes table to include meaningful data and exclude outliers. Right click the table header of the column that you need to filter, or click Filter directly above the table to see filter options. The contour for shapes filtered out of the table will not be displayed on the image.
- Area
-
Number of pixels enclosed within the contour of a shape.
In some cases, some detected shapes may show an Area of
0in the Morphology Shapes table. This is a numerical artifact of the arrangement of pixels that are present and how those pixels are used in methods that calculate other values.These rows can be useful to show in the table as a measure of how suitable morphology analysis parameters are for detecting shapes in the image. If many zero-area shapes are present, that may indicate an inherently noisy collection, such as dust on the slide, and a very long major axis may indicate a hair on a plate.
- Perimeter
-
The length of the contour around the shape.
- Equivalent Diameter
-
The diameter of the circle whose area is same as the contour area.

- Minor Axis Length
-
The length of the shortest diameter of an ellipse fitted to the contour of the shape.
- Major Axis Length
-
The length of the longest diameter of an ellipse fitted to the contour of the shape.
- Threshold Upper
-
Upper limit of pixel intensities used to define the image mask when Custom Threshold is used to draw detect objects.
Pixels above this limit are excluded from the mask and are not detected using Custom Threshold.
- Threshold Lower
-
Lower limit of pixel intensities used to define the image mask when Custom Threshold is used to draw detect objects.
Pixels below this limit are excluded from the mask and are not detected using Custom Threshold.
- Centroid
-
The geometric centroid of the shape.
- Compactness
-
The compactness of the shape (the ratio of the perimeter squared to
4 × π × Area).
- Circularity
-
How closely a shape resembles a circle (from 0 to 1, where 1 is perfectly circular).

- Eccentricity
-
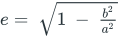
Measure of how much a shape deviates from being circular.
- Feret Diameter (Mean, Maximum, and Minimum)
-
Distance between two parallel tangents on opposite sides of a shape. The Feret Mean, Feret Maximum, and Feret Minimum are calculated from many orientations of the shape. Sometimes the analogy "caliper diameter" is used to explain the Feret Diameter.
- Solidity
-
The solidity of the shape (the ratio of the area to its convex hull area).

Morphology Shapes Table
The Morphology Shapes table is where the morphology analysis measurements described in this topic are shown for each shape. Measurements in the table are shown in pixels. To export data in physical units instead of pixels, click Export Summary Data on the Morphology Analysis ribbon and choose Length units. Supported physical units are mm, um, and cm.
The Shapes column indicates which type of shape each shape in the morphology analysis is. This column is not displayed in the Morphology Shapes table by default. To add it, click Columns and select Shapes.
| Shapes Column Value | Shape Type |
|---|---|
| Rectangle | User-drawn rectangle |
| Ellipse | User-drawn ellipse |
| Polygon | User-drawn polygon |
| Auto | Detected shape, whether detected using Threshold Detection or Auto Detection |