Good Westerns Gone Bad
Troubleshooting information for chemiluminescent Western blots
Introduction to Western Blotting
Scientists use Western blotting to identify a protein within a complex mixture. It was first introduced by Towbin et al. in 1979 as a simple method to electrophoretically blot proteins to nitrocellulose sheets (1). Since then, Western blotting methods for immobilizing proteins onto a membrane have become a common laboratory technique. Although many alterations to the original protocol have also been made, the general premise still exists. Macromolecules are separated using gel electrophoresis then transferred to a membrane–typically nitrocellulose or polyvinylidene fluoride (PVDF). The membrane is blocked to prevent non-specific binding of antibodies and probed with some form of detection antibody or conjugate.
This document will discuss some factors that may alter the performance of a chemiluminescent Western blot, resulting in “good Westerns, gone bad.”
Maximizing Sensitivity
The most important procedural difference between using film and digital imaging is related to the timing of image acquisition. Film is more tolerant about processing time, as you can always expose for a longer period if needed, whereas digital imaging requires that you capture the most photons within a finite imaging window. This window begins immediately after the addition of room temperature substrate.
Longer acquisitions in digital imaging do not correlate to results of longer exposures on film, as background noise can begin to contribute signal that impacts your overall limits of detection.
Possible Sources of Weak Signal
If you are seeing weak signal in your data, the following sources may be contributing factors. Each possible source includes solutions or precautions to improve signal strength
In the example images below, SuperSignal™ West Dura provides comparable performance to WesternSure® PREMIUM Chemiluminescent Substrate.
Cold substrate
Substrate needs to be equilibrated to room temperature for digital imaging. Enzyme activity is greatly reduced when the substrate is cold. See Table 9.
Ensure you have equilibrated the substrate to room temperature before imaging.
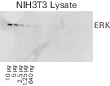
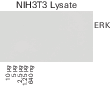
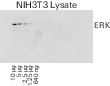
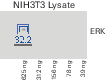
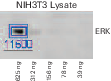
Table 9. Performance differences of a blot when the substrate has been equilibrated to room temperature versus being imaged with cold substrate.
| |
Optimal |
Unsatisfactory |
| Image |
|
|
| Substrate |
SuperSignal™ West Pico |
SuperSignal™ West Pico |
| Substrate Temperature |
Room temperature |
Cold (4 °C) |
| Sensitivity Setting |
Standard |
Standard |
| Signal |
1,740 |
200 |
Slow substrate reaction
Different substrates have different rates of reaction. Some are developed to give off a lot of light quickly; others give off small amounts of light over longer periods of time. See Table 10.
When digitally imaging blots with low protein abundance, a substrate with a faster reaction time, such as WesternSure® PREMIUM or SuperSignal™ West Femto, may be required.
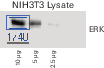
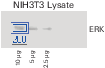
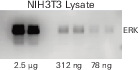
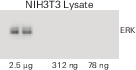
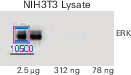
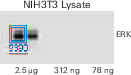
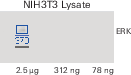
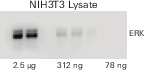
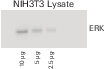
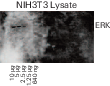
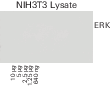
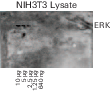
Table 10 . Performance differences of three different substrate classifications using C‑DiGit Blot Scanner. Each blot was place in substrate directly applied to the glass surface of a C‑DiGit Blot Scanner. The membrane was then covered with a 1-ply sheet protector and incubated before imaging. All images are normalized in Image Studio™ Software to the Lookup Table (LUT) settings of the optimal blot for accurate visual comparison.
| |
Optimal |
Satisfactory |
Unsatisfactory |
| Image |
|
|
|
| Substrate |
SuperSignal™ West Femto |
SuperSignal™ West Dura |
SuperSignal™ West Pico |
| Substrate Volume |
3.0 mL |
3.0 mL |
3.0 mL |
| Incubation Time |
5 minutes |
5 minutes |
5 minutes |
Scan
Setting |
High |
High |
High |
| Limits of Detection |
78 ng |
312 ng |
2.5 μg |
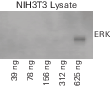
Not enough substrate
Without enough substrate on the blot, the light-generating luminol will quickly be depleted, leading to few photons (light) being released and a weaker signal. See Table 11 and Table 12.
Ensure you have added at least 0.1 mL/cm2 of substrate to your blot. For a 7 x 4 cm blot, this would be approximately 3 mL of substrate.
For the Odyssey M, Odyssey XF, or Odyssey Fc Imager, place the substrate on the blot itself before imaging. For the C‑DiGit Blot Scanner, the substrate can be:
Table 11. Performance differences when incubating the blot in different volumes of substrate. All three blots have the same limits of detection (2.5 µg/well); however, signal intensity varies. Each blot was placed in substrate directly applied to the glass surface of a C‑DiGit Blot Scanner. The membrane was then covered with a 1-ply sheet protector and incubated before imaging. All images are normalized to the LUT of the optimal blot for accurate visual comparison.
| |
Optimal |
Satisfactory |
Unsatisfactory |
| Image |
|
|
|
| Substrate |
SuperSignal™ West Pico |
SuperSignal™ West Pico |
SuperSignal™ West Pico |
| Substrate Volume |
3.0 mL |
1.5 mL |
0.75 mL |
| Incubation Time |
5 minutes |
5 minutes |
5 minutes |
| Scan Setting |
High |
High |
High |
| Performance |
Bright signal |
Moderate signal |
Low signal |
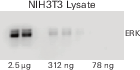
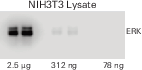
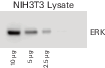
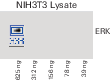
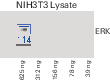
Table 12. Performance differences when incubating the blot in different volumes of substrate. Each blot was placed in substrate directly applied to the glass surface of a C‑DiGit Blot Scanner. The membrane was then covered with a 1-ply sheet protector and incubated before imaging. All images are normalized to the LUT of the optimal blot for accurate visual comparison.
| |
Optimal |
Satisfactory |
Unsatisfactory |
| Image |
|
|
|
| Substrate |
SuperSignal™ Dura |
SuperSignal™ Dura |
SuperSignal™ Dura |
| Substrate Volume |
3.0 mL |
1.5 mL |
0.75 mL |
| Incubation Time |
5 minutes |
5 minutes |
5 minutes |
Scan
Setting |
High |
High |
High |
| Limits of Detection |
78 ng |
312 ng |
2.5 μg |
Diluted substrate
The rate of reaction is determined by the ratio of enzyme to substrate. Diluting the substrate will dramatically impact the overall generation of light. See Table 13.
Ensure you do not dilute your substrate.
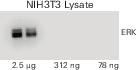
Table 13. Performance differences of a blot without diluted substrate versus an identical blot with diluted substrate.
| |
Optimal |
Unsatisfactory |
| Image |
|
|
| Substrate |
SuperSignal™ West Dura |
SuperSignal™ West Dura |
| Dilution |
Not diluted |
Diluted 1:1 in water |
| Limits of Detection |
1.25 µg |
2.5 µg |
Short incubation time
Manufacturers typically recommend an incubation time of five minutes for optimal photon emission. See Table 14.
Ensure you incubate the blot in substrate for five minutes before imaging on a digital imager.
Do not compromise the 5-minute incubation time.
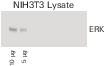
Table 14. Performance differences of a blot when doing a five-minute substrate incubation versus doing no substrate incubation.
| |
Optimal |
Unsatisfactory |
| Image |
|
|
| Substrate |
SuperSignal™ West Pico |
SuperSignal™ West Pico |
| Incubation Time |
5 minutes |
No incubation |
| Limits of Detection |
2.5 µg |
5 µg |
Uneven wetting during acquisition
Without enough substrate on the blot, the membrane will not stay wet, and there will be no enzymatic activity. See Table 15.
Ensure you have added at least 0.1 mL/cm2 of substrate to your blot (3.0 mL for a 7 x 4 cm blot) and avoid completely removing all the excess substrate before imaging.
For the C‑DiGit Blot Scanner, you can also try:
For the , cover the membrane completely with the silicone mat to keep the membrane moist during the scan.
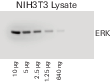
Table 15. Performance differences when the same blot is imaged wet, damp, and dry. Blots were all imaged on the C‑DiGit Blot Scanner. Images are normalized to the LUT of the optimal wet blot for accurate visual comparison.
| |
Optimal |
Optimal |
Unsatisfactory |
| Image |
|
|
|
| Substrate |
SuperSignal™ West Dura |
SuperSignal™ West Dura |
SuperSignal™ West Dura |
| Blot Condition |
Wet |
Damp |
Dry |
Imaging
Method |
Placed in 3.0 mL substrate on glass surface, covered with 1-ply sheet protector, then imaged |
Removed excess substrate, covered with 1-ply sheet protector, then imaged |
Dried then imaged |
Limits of
Detection |
640 ng |
640 ng |
None detected |
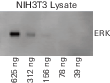
Incorrect membrane placement
If the blot is placed incorrectly on your imager, you may or may not be able to see the bands. Even if bands are visible, they will have significantly reduced signal. See Table 16.
Ensure that the blot is placed with the protein facing toward the detection system. For the or C‑DiGit Blot Scanner, the protein should face down toward the glass surface. For the Odyssey XF or Odyssey Fc Imager, the protein should face up.
Table 16. Performance differences when imaging the blot with the protein facing toward and away from the detection system of the C‑DiGit Blot Scanner. Images are normalized to the LUT of the correctly imaged blot for accurate visual comparison.
| |
Correctly Placed |
Incorrectly Placed |
| Image |
|
|
| Substrate |
SuperSignal™ West Dura |
SuperSignal™ West Dura |
| Orientation |
Protein down |
Protein up |
| Limits of Detection |
156 ng |
625 ng |
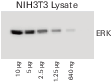
Processed and imaged on different days
Digital imaging requires capturing the most photons being generated, which is typically right after a 5-minute incubation. Secondary antibodies and/or substrate are not stable enough to provide acceptable photon emission when digitally imaged the day after they have been applied. See Table 17 and Table 18.
Ensure that the blot is processed and imaged on the same day. The secondary antibody should be incubated the day of imaging and fresh substrate added shortly before imaging.
Table 17. Performance differences when the same blot is imaged immediately after processing versus being stored overnight dry and then imaged. Blots were all imaged on the C‑DiGit Blot Scanner. lmages are normalized to the LUT of the optimal blot for accurate visual comparison.
| |
Optimal |
Satisfactory |
Unsatisfactory |
| Image |
|
|
|
| Substrate |
SuperSignal™ West Dura |
SuperSignal™ West Dura |
SuperSignal™ West Dura |
Processing
Time |
Same day |
Next day |
Next day |
Detection
Process |
HRP secondary incubated, washed, and substrate added immediately before imaging |
HRP secondary incubated, washed, and substrate added the day before imaging |
HRP secondary incubated, washed, and substrate added the day before imaging, then re-incubated with HRP secondary and substrate added immediately before imaging |
| Storage |
Not stored |
Overnight dry at room temperature |
Overnight dry at room temperature |
Limits of
Detection |
640 ng |
None detected |
1.25 µg |
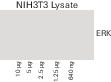
Table 18. Performance differences when the same blot is imaged immediately after processing versus being stored overnight wet and then imaged. Blots were all imaged on the C‑DiGit Blot Scanner. lmages are normalized to the LUT of the optimal blot for accurate visual comparison.
| |
Optimal |
Satisfactory |
Unsatisfactory |
| Image |
|
|
|
| Substrate |
SuperSignal™ West Dura |
SuperSignal™ West Dura |
SuperSignal™ West Dura |
Processing
Time |
Same day |
Next day |
Next day |
Detection
Process |
HRP secondary incubated, washed, and substrate added immediately before imaging |
HRP secondary incubated, washed, and substrate added the day before imaging |
HRP secondary incubated, washed, and substrate added the day before imaging, then re-incubated with HRP secondary and substrate added immediately before imaging |
| Storage |
Not stored |
Overnight wet in PBS at room temperature |
Overnight wet in PBS at room temperature |
Limits of
Detection |
640 ng |
None detected |
1.25 µg |
Film exposure before digital imaging
Digital imaging requires capturing the most photons being generated, which is typically right after a 5-minute incubation. Time may be more of an issue with some substrates. See Table 19, Table 20, and Table 21.
If you want to use film, image your blot on a digital imager first, then expose the blot to film.
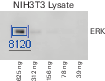
Table 19. Performance differences of a blot when the same blot is imaged over time. Blot was imaged on the C‑DiGit Blot Scanner. Images are normalized to the LUT of the optimal blot for accurate visual comparison.
| |
Optimal |
Unsatisfactory |
Unsatisfactory |
| Image |
|
|
|
| Substrate |
SuperSignal™ West Pico |
SuperSignal™ West Pico |
SuperSignal™ West Pico |
| Incubation Time |
5 minutes |
5 minutes |
5 minutes |
| Imaging Method |
Immediately after incubation |
26 minutes after incubation |
51 minutes after incubation |
| Scan Setting |
High |
High |
High |
Limits of
Detection |
625 ng |
625 ng |
625 ng |
| Signal |
338 |
114 |
32.2 |
Table 20. Performance differences of a blot when the same blot is imaged over time. Blot was imaged on the C‑DiGit Blot Scanner. Images are normalized to the LUT of the optimal blot for accurate visual comparison.
| |
Optimal |
Unsatisfactory |
Unsatisfactory |
| Image |
|
|
|
| Substrate |
SuperSignal™ West Dura |
SuperSignal™ West Dura |
SuperSignal™ West Dura |
| Incubation Time |
5 minutes |
5 minutes |
5 minutes |
| Imaging Method |
Immediately after incubation |
24 minutes after incubation |
48 minutes after incubation |
| Scan Setting |
High |
High |
High |
Limits of
Detection |
156 ng |
156 ng |
156 ng |
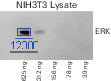
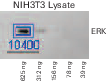
| Signal |
12,300 |
10,400 |
9,090 |
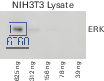
Table 21. Performance differences of a blot when the same blot is imaged over time. Blot was imaged on the C‑DiGit Blot Scanner. Images are normalized to the LUT of the optimal blot for accurate visual comparison.
| |
Optimal |
Unsatisfactory |
Unsatisfactory |
| Image |
|
|
|
| Substrate |
SuperSignal™ West Femto |
SuperSignal™ West Femto |
SuperSignal™ West Femto |
| Incubation Time |
5 minutes |
5 minutes |
5 minutes |
| Imaging Method |
Immediately after incubation |
24 minutes after incubation |
48 minutes after incubation |
| Scan Setting |
High |
High |
High |
Limits of
Detection |
156 ng |
156 ng |
156 ng |
| Signal |
11,500 |
10,400 |
6,860 |
Incorrect sensitivity setting
Generally, digital imaging with the Odyssey M, Odyssey XF, Odyssey Fc, or C‑DiGit will not reach a saturation point.
For the C‑DiGit Blot Scanner, begin with a longer acquisition time to ensure optimal sensitivity. In Image Studio™ Software, use a Sensitivity setting of High (12-minute scan) for more sensitive detection, then optimize to shorter scan times. See Table 22.
For the Odyssey Fc Imager, use a longer Integration Time in Image Studio (up to 10 minutes).
For the Odyssey M or Odyssey XF Imager, follow the Membrane workflow provided in LI‑COR® Acquisition Software to acquire a chemiluminescent image.
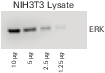
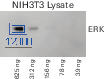
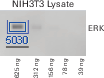
Table 22. Performance differences of a blot when the same blot is imaged on High Sensitivity versus Standard Sensitivity. Blot was imaged on the C‑DiGit Blot Scanner. Images are normalized to the LUT of the optimal blot for accurate visual comparison.
| |
Optimal |
Satisfactory |
| Image |
|
|
| Substrate |
SuperSignal™ West Dura |
SuperSignal™ West Dura |
| Sensitivity Setting |
High (12 minutes) |
Standard (6 minutes) |
| Signal |
12,300 |
5,030 |
References
1. Towbin, H., Staehelin, T., and Gordon, J. (1979). Electrophoretic transfer of proteins from polyacrylamide gels to nitrocellulose sheets: procedure and some applications. Proc Natl Acad Sci USA, 76(9), 4350-4354. https://doi.org/10.1073%2Fpnas.76.9.4350
Was this page helpful? Please let us know.