Housekeeping Protein Validation Protocol
Introduction
In quantitative Western blotting (QWB), normalization mathematically corrects for unavoidable sample-to-sample and lane-to-lane variation by comparing the target protein to an internal loading control. The internal loading control is used as an indicator of sample protein loading, to correct for loading variation and confirm that observed changes represent actual differences between samples.
For more normalization related resources, see " Further Reading".
Using a Housekeeping Protein for Normalization
Housekeeping proteins (HKPs) are routinely used for Western blot normalization. For common HKPs (such as actin, tubulin, or GAPDH), stable protein expression is generally assumed. However, expression of several HKPs is now known to vary in response to certain experimental conditions, including cell confluence, disease state, drug treatment, and cell or tissue type. Because HKP normalization uses a single indicator of sample loading, changes in HKP expression or stability will introduce error and may alter data analysis and interpretation.
Before using a housekeeping protein for Western blot normalization, it is critical to validate that its expression is constant across all samples and unaffected by the specific experimental context and conditions.
This protocol explains how to validate an HKP for use as an internal loading control, by demonstrating that HKP expression is stable in the relevant experimental samples.
This protocol is intended for use with fluorescent Western blots.
Keys for Success
Keys for Success
-
Saturation and linear range. Saturated bands and sample overloading frequently compromise the accuracy of QWB. Use a dilution series to verify that you are working within the linear range of detection, and signal intensity is proportional to sample loading. See the protocol: Determining the Linear Range for Quantitative Western Blot Detection (licorbio.com/LinearRange) for more information.
-
Replication. Replicate samples provide information about the inherent variability of your methods, to determine if the changes you see are meaningful and significant. A minimum of three technical replicates is recommended for each sample.
-
Uniform sample loading. Uniform loading of total sample protein across the gel is critical for accurate QWB analysis. A protein concentration assay (BCA, Bradford, or similar assay) must be used to adjust sample concentration and load all samples as consistently as possible.
You can use reagents designed to confirm uniform sample loading, such as Odyssey Loading Indicators (P/N 926-20002), to improve the accuracy of this validation protocol. However, these reagents do not preclude the need to perform a protein concentration assay before sample preparation and loading.
-
Antibody validation. Two-color Western blot detection requires careful selection of primary and secondary antibodies to prevent cross-reactivity. Always perform single-color control blots first to verify antibody specificity, and to identify possible interference from background bands.
The Antibody Publication Database can help you find antibody pairs that work for your experiment (licorbio.com/antibodyrequest).
-
Antibody validation. Verify specificity of the phospho-antibody to ensure that it does not cross-react with the unmodified target protein, and to identify possible interference from background bands. Important guidelines are provided in Section
The Antibody Publication Database can help you find antibody pairs that work for your experiment (licorbio.com/antibodyrequest).
-
Phosphorylation stoichiometry. This protocol is intended for relative comparison of pan-protein and phospho-protein signals, and results do not indicate the stoichiometry of phosphorylation (1).
Required Reagents
-
Treated and untreated samples
Protein concentration must be determined for all samples.
-
Revert™ 700 Total Protein Stain Kit (licorbio.com/revertkit)
Revert 700 Total Protein Stain is used to assess sample protein loading in each lane as an internal loading control. After transfer and prior to immunodetection, the membrane is treated with this fluorescent protein stain and imaged. Membrane staining can verify that sample protein was uniformly loaded across the gel, and assess the quality and consistency of protein transfer.
If your instrument can capture only near-infrared signals, use Revert 700 Total Protein Stain, which can be visualized in the 700 nm channel. For instruments that can also capture signal in the visible range, such as the , you can use Revert 520 Total Protein Stain (licorbio.com/revert-520-kit), which can be visualized in the 520 nm channel.
-
Odyssey Loading Indicator, 800 nm (P/N 926-20002)
Odyssey Loading Indicator (OLI) is an external loading control that is added to your samples just before electrophoresis and is used to verify that a similar sample volume was loaded in each lane. Because it is an exogenous protein, it does not provide information about the amount of sample protein loaded or transferred.
OLI is a 28 KDa recombinant protein and should not be used in this protocol with HKPs of similar molecular weight.
-
Electrophoresis reagents
-
Transfer reagents
-
Pan-specific and modification-specific antibodies against target protein
-
Fluorescent Western blot detection reagents
Perform fluorescent Western blot detection according to the Fluorescent Western Blot Detection Protocol (licorbio.com/NIRWesternProtocol).
Protocol
This protocol highlights the main steps to run a Western blot used to validate your housekeeping protein.
Step 1. Prepare and Transfer Proteins
-
Generate a set of samples representing the specific range of treatments or conditions you will use in your experiment (drug treatment, time course, dose response, etc.).
A minimum of three replicates should be performed for each sample.
-
Determine the protein concentration of each sample using a BCA, Bradford, or similar protein assay. Below are some example assays that can be detected using the and analyzed in Empiria Studio® Software. See the protocol: Protein Concentration Estimation Guide (licorbio.com/protein-estimation).
-
Micro BCA
-
Bradford
-
Pierce 660
-
Modified Lowry
-
-
Determine the Final Volume per well for all samples to be loaded based on the well capacity of your gel (see ) and the linearity of your assay. See the protocol: Determining the Linear Range for Quantitative Western Blot Detection (licorbio.com/LinearRange).
-
Determine the Sample Volume required to add the proper amount of Odyssey Loading Indicator. Sample Volume should be equal to 75% of the Final Volume per well.
For example, if Final Volume per well is 10 µL, Sample Volume should be 7.5 µL.
-
Dilute samples to equal concentration with appropriate sample buffer to equal the Sample Volume determined in step 3.
All samples should have the same final protein concentration and volume.
|
Sample Volume (μL) |
Odyssey Loading Indicator (with β-ME, μL) |
Final Volume per Well (μL) |
| 7.5 | 2.5 | 10 |
| 9.0 | 3.0 | 12 |
| 10.5 | 3.5 | 14 |
| 12.0 | 4.0 | 16 |
| 13.5 | 4.5 | 18 |
| 15 | 5.0 | 20 |
-
Prepare samples for gel loading according to the instructions for Odyssey Loading Indicator (800 nm).
-
Denature sample by heating at 95 °C for 3 min (or 70 °C for 10 min).
-
Load an equal volume of sample, and uniform amount of sample protein, in each lane.
-
Separate sample proteins by SDS-PAGE.
-
Transfer proteins to blotting membrane.
Step 2. Stain with Revert™ 700 Total Protein Stain
- Add methanol to the stain reagents as indicated on each bottle.
-
After transfer is complete, fully dry the membrane. Place the membrane on top of a piece of clean filter paper and allow it to dry by choosing one of the following:
-
40 to 60 minutes at room temperature.
-
10 minutes in an oven at 37 °C.
-
Overnight at room temperature as a stopping point.
-
-
Rehydrate the membrane after fully drying.
-
For nitrocellulose membranes, incubate the membrane in TBS or PBS (no detergent) for 5 minutes at room temperature with gentle shaking.
-
For PVDF membranes, first rehydrate using 100% methanol for 30 seconds. Then rinse in TBS or PBS (no detergent) for 5 minutes at room temperature with gentle shaking.
Do not allow the membrane to dry from this point on.
-
-
Rinse the membrane with ultrapure water.
Before moving to the next step, ensure the membrane container provides a minimum clearance of 1/8th of an inch on all sides. Revert 700 Total Protein Stain will cause the membrane to swell. Without clearance, staining may be uneven.
-
Stain membrane with Revert 700 Total Protein Stain. Incubate the membrane in 5 mL of Revert 700 Total Protein Stain solution for 5 minutes at room temperature with gentle shaking.
For more information about the Revert protocol, see licorbio.com/revert.
-
Decant total protein stain solution thoroughly. Using approximately 5 mL of Revert 700 Wash Solution (P/N 926-11012), rinse the membrane two times for 30 seconds at room temperature with gentle shaking.
-
Decant wash solution thoroughly, then briefly rinse the membrane with ultrapure water.
You do not need to destain Revert 700 Total Protein Stain in this protocol as you will be visualizing your HKP and OLI in the 800 nm channel. If you wish to visualize several HKPs in the 700 nm and 800 nm channels, you can do so by destaining Revert according to the instructions in your pack insert.
Step 3. Image Membrane
-
Immediately image the membrane using an Odyssey Imager. Use the 700 nm channel for Revert™ 700 Total Protein Stain. If saturation occurs, reduce the scan intensity or acquisition time, or use AutoScan if your instrument includes this.
-
Proceed immediately to blocking and follow your normal Western blot protocol using IRDye® 800CW Secondary Antibody to detect your HKP in the 800 nm channel.
-
Image the membrane in the 800 nm channel with an Odyssey Imager. Adjust the acquisition settings so that no saturation appears in the bands to be quantified.
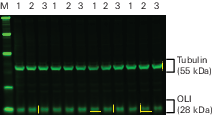
You can probe for multiple targets in the 800 nm channel at once. This is useful if you need to validate multiple HKPs of distinct molecular weight. Ensure the primary antibodies do not cross-react.
Total Protein and HKP Quantification
Quantify the fluorescent signals from the total protein stain (700 nm or 520 nm), HKP (800 nm), and loading indicator (800 nm). An Empiria Studio® Software workflow guides you through this process step-by-step. The provided Image Studio™ Software instructions are for the 700 nm and 800 nm channels only.
To learn more about the Empiria Studio® Software workflow for this process, go to licorbio.com/empiria.
Target Protein and HKP Quantification
Quantify the fluorescent signals of the HKP (700 nm) and target protein (800 nm). The following instructions are for Image Studio™ Software. The Empiria Studio Software HKP Normalization workflow guides you step-by-step through the process.
To learn more about the Empiria Studio® Software workflow for this process, go to licorbio.com/empiria.
Total Protein and Target Quantification
Quantify the fluorescent signals from Revert staining (700 nm) and your target protein (800 nm). The following instructions are for Image Studio™ Software. An Empiria Studio® Software workflow guides you step-by-step through the process.
To learn more about the Empiria Studio® Software workflow for this process, go to licorbio.com/empiria.
Pan Protein and Phospho-Protein Quantification
Quantify the fluorescent signals for the pan protein (700 nm) and phosphorylated target protein (800 nm). The following instructions are for Image Studio™ Software. The Empiria Studio® Software Post-Translational Modification workflow guides you step-by-step through the process.
To learn more about the Empiria Studio® Software workflow for this process, go to licorbio.com/empiria.
Total Protein Quantification
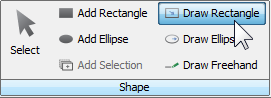
The Empiria Studio® Software Linear Range Determination workflows guide you step-by-step through this process. For more detailed information, see the Linear Range Determination in Empiria Studio Software (licorbio.com/LinearRangePaper) white paper. The following instructions are for using Image Studio™ Software.
Before you begin, under the Analysis tab change the type to Manual. Use the Draw Rectangle tool in Image Studio Software to quantify the total protein signal in each lane.
|
|

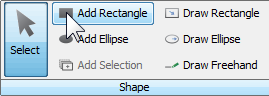
HKP Quantification (800 nm image)
Before you begin, under the Analysis tab change the type to Manual. Use the Add Rectangle tool in Image Studio Software to quantify the HKP bands (800 nm channel). Loading indicator bands will also be analyzed in the 800 nm image.
|
|

Calculations
Empiria Studio® Software will perform these calculations automatically. Please continue to the Data Interpretation section.
Prepare a spreadsheet, similar to the example below, that contains all total protein stain, HKP, and OLI quantification values using spreadsheet software.
-
Calculate the average signal intensity for replicate samples.
“Average” formula in Excel = AVERAGE(rep 1, rep 2, ……)
Average Signal for Total Protein
Treatment rep 1 rep 2 rep 3 Avg St Dev % CV 0% 2,030,000 2,060,000 2,100,000 2,063,333 35,119 2% 33% 2,110,000 2,120,000 2,120,000 2,116,667 5,774 0% 66% 2,080,000 2,100,000 2,120,000 2,100,000 20,000 1% 100% 2,060,000 2,110,000 2,070,000 2,080,000 26,458 1% Average Signal for HKP (Tubulin)
Treatment rep 1 rep 2 rep 3 Avg St Dev % CV 0% 9,190 9,070 8,780 9,013 211 2% 33% 8,210 7,760 7,340 7,770 435 6% 66% 6,650 7,270 7,780 7,233 566 8% 100% 7,770 7,590 7,370 7,577 200 3% Average Signal for Odyssey Loading Indicator
Treatment rep 1 rep 2 rep 3 Avg St Dev % CV 0% 5,000 4,980 5,170 5,050 104 2% 33% 5,220 5,320 5,320 5,287 58 1% 66% 5,310 5,220 5,210 5,247 55 1% 100% 5,150 4,880 5,310 5,113 217 4% -
Calculate the Standard Deviation of the replicate treatment conditions.
Standard Deviation formula in Excel = STDEV(rep 1 value, rep 2 value, …..)
-
Calculate the Coefficient of Variation (CV) of the replicate treatment conditions.

-
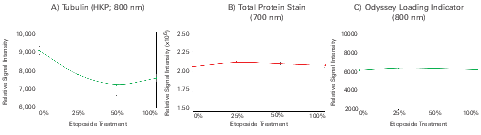
Separately plot the relative signal intensities for each data set, HKP, total protein stain, and loading indicator (as in Figure 119).
Data Interpretation
-
Evaluate results to determine if expression of this HKP is stable across samples.
-
Were samples uniformly loaded across the gel?
-
Consistent signals for Revert™ Total Protein Stain (as in Fig. 1B, with an approximately horizontal line) confirm that the amount of sample protein loaded was consistent and uniform.
-
Consistent signals from the Odyssey Loading Indicator (Fig. 1C) indicate that a uniform sample volume was loaded.
-
Inconsistent signals indicate a problem with sample loading, and HKP expression cannot be accurately evaluated. Repeat the Western blot experiment with uniformly loaded samples.
-
-
If samples were uniformly loaded, the intensity of HKP bands should reflect actual HKP expression levels in your samples.
-
Stable HKP bands indicate that actual HKP protein levels were stable in these samples. This HKP may be suitable for Western blot normalization.
The HKP must be revalidated if there are changes in experimental treatments, conditions, cell lines, etc.
-
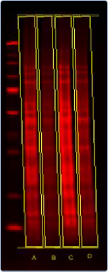
Variation in HKP band intensity indicates that actual HKP expression was altered by your experimental conditions (Fig. 1A). This HKP should not be used for normalization.
-
-
If samples were not uniformly loaded, HKP bands may not accurately reflect actual HKP expression in these samples.
HKP validation results cannot be accurately interpreted, and the Western blot experiment should be repeated with careful attention to uniform sample loading.
-
-
If results indicate that HKP expression is affected by experimental conditions, this HKP should not be used for normalization. Next steps should be:
-
Repeat this process to evaluate additional HKPs, or
-
Consider total protein staining of the membrane for Western blot normalization. Revert Total Protein Stain is a robust alternative to HKPs.
-
Total protein staining is not affected by changes in the expression of a single internal reference protein.
-
It provides an accurate readout of sample loading across a wide range, from 1 - 60 µg of total sample protein.
-
Re-validation is not required for different experimental treatments, cell lines, or other experimental parameters.
-
-
Further Reading
Please see the following for more information about QWB analysis.
-
Western Blot Normalization Handbook
The Normalization Handbook describes how to choose and validate an appropriate internal loading control for normalization.
-
Good Normalization Gone Bad
Good Normalization Gone Bad presents examples of normalization that have been adversely affected by common pitfalls and offers potential solutions.
-
Western Blot Normalization White Paper
licorbio.com/normalizationreview
This white paper comprehensively reviews the literature of Western blot normalization.
-
Determining the Linear Range for Quantitative Western Blot Detection
This protocol explains how to choose an appropriate amount of sample to load for QWB analysis.
-
Revert™ Total Protein Stain Normalization Protocol
licorbio.com/RevertNormalization
This protocol describes how to use Revert Total Protein Stain for Western blot normalization and analysis.
-
Pan/Phospho Analysis For Western Blot Normalization
licorbio.com/PanProteinNormalization
This protocol describes how to use pan-specific antibodies as an internal loading control for normalization.
-
Housekeeping Protein Validation Protocol
This protocol explains how to validate an HKP for use as an internal loading control, by demonstrating that HKP expression is stable in the relevant experimental samples.
-
Housekeeping Protein Normalization Protocol
licorbio.com/HKP-Normalization
This protocol describes how to use a housekeeping protein for Western blot normalization and quantitative analysis.
-
Linear Range Determination in Empiria Studio® Software White Paper
This white paper describes how Empiria Studio Software guides the user through the linear range validation process and documents the results for future use.