Quantitative Western Blot: HKP Validation (Compare Bands)
Before using a housekeeping protein for Western blot normalization, it is critical to validate that its expression is constant across all samples and is unaffected by the specific experimental context and conditions.
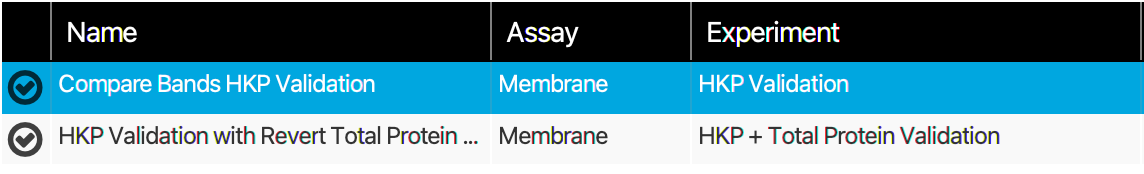
Name
To help with record-keeping, give every Experiment a distinct name. The description field provides space for you to include important details about the Experiment.
Set up images
Ensure the correct images have been chosen, then enter information for the protein bands being analyzed.
Click the zoom buttons above the image to make the displayed image smaller or larger . A zoom level, shown as a percentage relative to the size of the software window, is shown next to the zoom buttons.
Define lanes
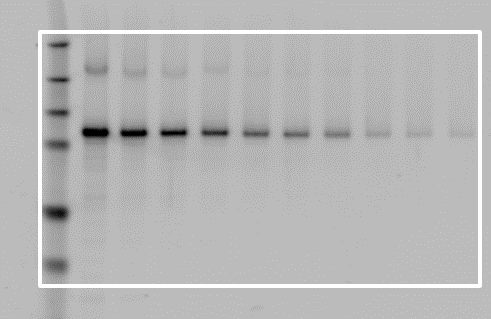
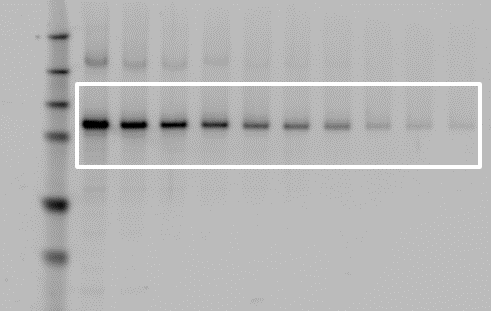
The Define lanes page identifies lanes on the image for analysis. To find lanes, draw a boundary that encloses all the lanes on the image.
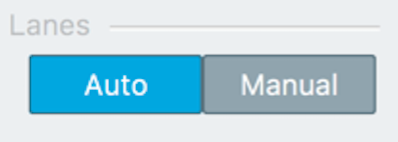
By default, Auto mode automatically performs lane finding. Manual mode is also available.
Tips for Drawing the Boundary
Draw the boundary around all the lanes, even if you do not plan to use all the lanes for your analysis. If necessary, you can exclude lanes from the analysis later in the workflow (for example, on the Add lane details page).
Examples
Correct Placement
Incorrect Placement
Comparison of Lane Finding Methods
Automatic Lane Finding
By default, Empiria Studio uses a patent-pending process called Adaptive Lane Finding (ALF) to automatically find the number of lanes and the precise boundaries of each lane.
For more information on the Adaptive Lane Finding process, see the Calculations Section.
Manual Lane Finding
Lanes can still be found manually (if necessary), providing consistency with previous versions of Empiria Studio. In Manual mode, you choose the number of lanes and place lane lines manually.
For more information about the differences between automatic lane finding and manual lane finding, see the Calculations Section.
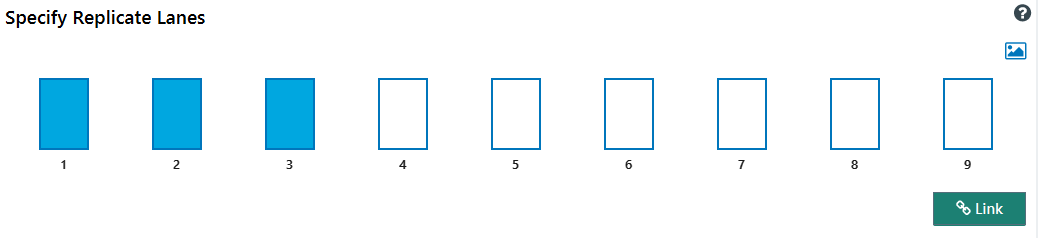
Specify replicate lanes
The Specify replicate lanes page allows you to link replicate lanes for analysis. The numbered rectangles displayed on the page correspond to the lanes on your blot.
Specify replicate lane groups
-
Click the rectangles that correspond to the lanes in your first group of replicates.
-
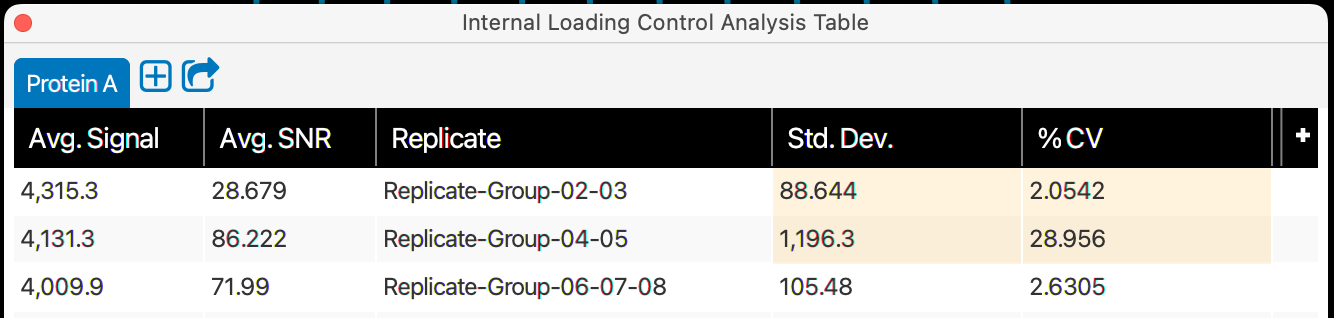
A minimum of two lanes is required to create a replicate group on this page. Replicates can be made with two lanes to allow analysis of replicate groups created on this page with other replicate lanes in a Replicate Analysis.
For a two-lane replicate group, the St. Dev. and %CV cells will be highlighted in yellow in Analysis Tables.
-
Click the Image View to see an image of the blot.
-
-
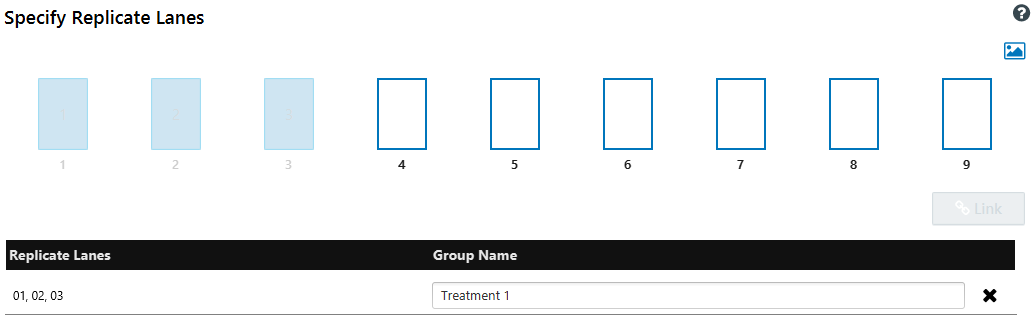
Click Link.
-
Assign the group a name in the Group Name column in the table.
-
Repeat this process for all the replicate groups on your blot.
Remove or recreate groups
Click next to the group name of any groups that were created incorrectly. You can then reassign the lanes to the correct groups.
Add lane details
Record important details about your samples.
-
Name: Provide a lane name to facilitate record keeping and organization.
-
Type: Specify the appropriate type for each lane.
-
Sample: Choose Sample for lanes that contain samples of the housekeeping protein being evaluated for stability.
-
MW Marker: Choose MW Marker for all lanes that contain a molecular weight marker.
Designate marker lanes now to size bands at a later step in the analysis.
-
Not Used: Choose Not Used for lanes you do not want to include in your analysis. For example, you might choose Not Used if a lane is empty. Empiria Studio will not find bands in lanes marked Not Used.
-
-
Treatment: Indicate a treatment and unit. The unit you specify will apply to all lanes.
Click the Autofill button
 to see options for quickly filling out the table.
Assign MW marker
Assign a molecular weight marker to estimate the molecular weight of bands. Estimated molecular weights will be available in the Analysis Table of the Quantify bands page.
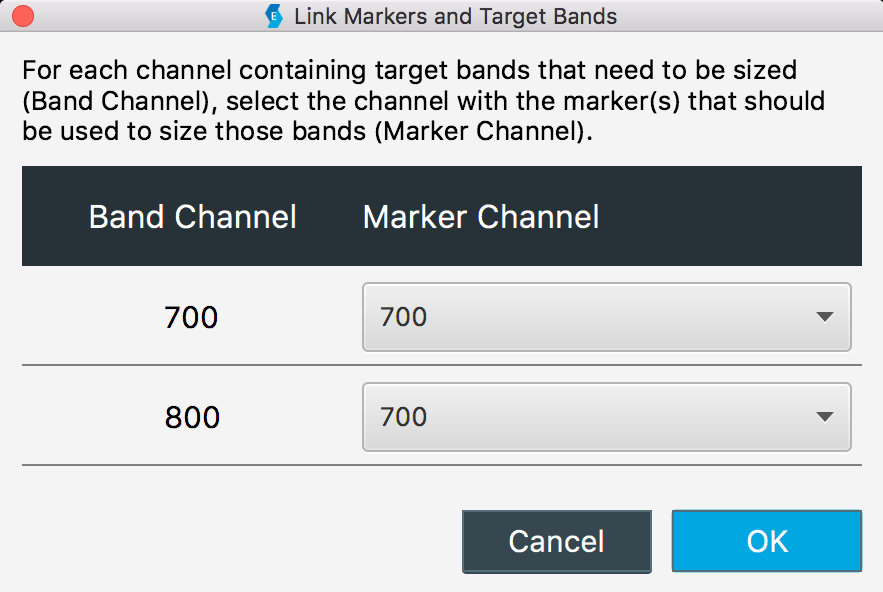
You can estimate the molecular weight of target bands in one channel using a marker in another channel when you link a Band Channel to a Marker Channel.
Assign Marker
To assign a marker, choose a marker from the list and add band boxes to at least three marker bands.
Use Existing Marker from the MW Marker List
-
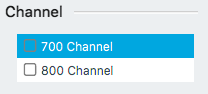
Ensure the correct channel is displayed and selected in the Channel list on the right side of the window.
Click the Channel Display button
 above the image to change which channels are displayed.
 -
Select a marker from the list.
Markers available from LI‑COR are available in the list by default.
-
Click Add to add band boxes to bands in the marker lane.
Once three band boxes have been, the channel will be checked in the Channel list. This check indicates that the marker is ready to estimate molecular weights in subsequent analysis steps.
Add New Marker
You can add other markers to the list, and markers you add will be available in other Experiments. To add a new marker:
-
Click New.
-
Enter a name for the marker.
-
Enter the first molecular weight and press Enter.
-
Continue adding molecular weights until all weights have been added, then click Create.
The molecular weight marker will be saved and assigned to the existing image for band sizing.
After a marker has been created, it cannot be edited. If you entered the molecular weight marker incorrectly, add a new marker with the correct information.
Link Marker
To size bands in one channel using a marker in different channel, link the channel that has the bands to be sized (the Band Channel) with the channel that has the marker (the Marker Channel).
Delete a Marker
You can delete markers that were added to the list, but you cannot delete markers that come with Empiria Studio.
-
The deleted marker will be removed from the list in the current Experiment.
-
The deleted marker will not be available in Experiments you create after deleting the marker.
-
The deleted marker, and band size data based on that marker, will be saved in other Experiments where the marker has already been used.
To delete a marker:
-
In the MW Marker section, click Information.
-
In the MW Marker Information dialog, click Delete.
-
Click Yes to confirm that you want to delete the marker.
Quantify bands
The Next button will not be active until you have identified a band in each lane (aside from lanes that you marked as Not Used or MW Marker on the Add lane details page).
Find and Quantify Bands
The Find Bands button will identify and quantity a band in every lane, except in lanes that you marked as MW Marker or Not Used on the Add lane details page.
-
Ensure the correct channel and band box are displayed for your analysis.
- Click the Channel Display button above the image to change which channels are displayed.
-
Click the Band Display button above the image to change which band boxes are displayed.
- Click the Channel Display button
-
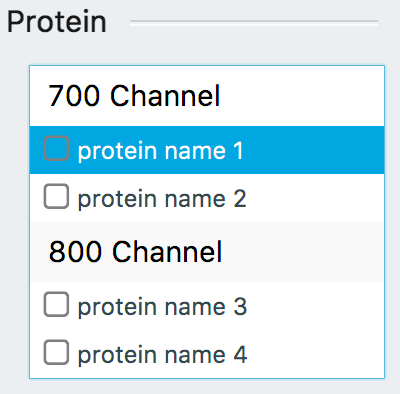
Select a protein name from the Protein list.
-
Click Find Bands.
-
Position your mouse over the image.
A horizontal line will appear.
-
Locate the horizontal line as close as possible to the bands of interest, then click.
Band boxes will be placed around bands in lanes near the horizontal line.
Add Individual Band Boxes
Click Add to identify individual bands one at a time. Bands cannot be added to lanes marked as Not Used or MW Marker.
-
Ensure the correct channel and band shapes are displayed for your analysis.
- Click the Channel Display button above the image to change which channels are displayed.
-
Click the Band Display button above the image to change which band boxes are displayed.
- Click the Channel Display button
-
Select a protein name from the Protein list.
-
Click Add, then click on the band.
A band box will be placed around the band.
-
Continue clicking bands until you have added all the band boxes you need to add, then click Done.
Manually Adjusting a Band Box
-
Before adjusting a band box, ensure your image display is set so that you can clearly see the entire band.
Click Image Display
 above the image to adjust the image display. Ensure some background is visible on the image so that you can completely see the edges of the band.
Avoid manually adjusting a band shape until you have carefully examined the band under appropriate image display settings.
-
Click the band box to select it.
-
Adjust the border of the band box by dragging anchor points, or click and drag inside the selected band box to reposition it.
Delete Band
Click the band box you want to remove and click Delete.
View Data
To view quantification data, click the Analysis Table.
-
Click Export above a table to export the data in the table in CSV or Excel (XLSX) format.
-
Customize which columns are included in the table by clicking in the table and selecting the columns you want to include.
-
Click a column header to sort the data in the table by the values in that column.
-
Click and drag column headers to rearrange the order of columns in the table.
Set up chart
The charts on the Set up chart page plot the signal for your housekeeping protein against the reference protein signal.
Specify a title, color, and axis labels on this page. You can export this page and your data on the next page (Review and report).
Review and report
The Review and report page allows you to record your observations and conclusions in the Summary field for future reference. Export individual images and data tables or export a PDF file containing the data and images.
The data in the report is organized into sections. Click to expand a section to view data and export options.
Images
-
Click above an image to export the image. Images can be exported as a high-resolution TIFF for publication in a journal or as a PNG appropriate for slide presentations. Do not use these images for analysis.
-
The units for image size can be set to English or metric on the General Options page.
-
Click Hide features to hide lane and band rectangles. If lane and band rectangles are hidden, they will not be included in the exported image or report.
Tables
Click Export above a table to export the data in the table in CSV or Excel (XLSX) format.
Export Menu Options
On the right side of the window, there is a menu with three export options.
-
Click PDF Report to export a PDF of the images and data on the Review and report page.
-
Click Experiment File to export all the images, quantification steps, and data from this Experiment to a single file that can be imported into Empiria Studio on another computer.
-
Click All Report Images to export all images from the Experiment to separate files for use in print publications or digital media (such as a slide presentation). Do not use these images for analysis.
In the export dialog, click Browse to find a parent folder for the images and enter a name for a new folder in the Folder Name field. The images will be exported into the new folder, which will be inside the parent folder.
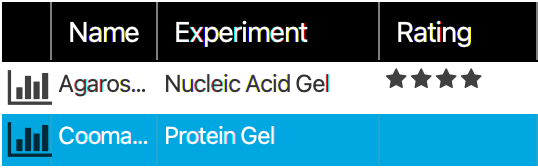
Rate Experiment
Rate the Experiment for your records. This is an opportunity to record if the Experiment went "well" or not, depending on the specific requirements for your research.
Done
Click Done to mark this Experiment as complete and return to the Experiment List.