Using Trim Values in Empiria Studio® Software Multiwell Plate Calculations
Learn how Trim Value calculations work in Empiria Studio Software and when to use Trim Values.
Introduction
In Empiria Studio, trim value calculations are provided to lessen the effect that "outlier pixels" have on the results of a multiwell plate image analysis. Throughout the following explanation, "outlier pixels" are those with extremely high pixel intensities and extremely low pixel intensities relative to other pixels in the same well.
What Causes Outlier Pixels?
Throughout this explanation, "outlier pixels" are those pixels in a multiwell plate image that have extremely high pixel intensities and extremely low pixel intensities relative to the intensities of other pixels in the same well. Many issues with a multiwell plate can cause outlier pixels, but these are some common causes of outlier pixels.
-
Contamination on the plate, such as dust
-
Speckling caused by antibody aggregation
How Can I Identify and Prevent Outlier Pixels?
It is best to prevent problems that cause outlier pixels, rather than trying to rely on trim value calculations.
| Cause of Outlier Pixels | Example | Preventative Measures |
|---|---|---|
| Dust contamination |
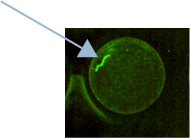
|
Prepare plates carefully in a clean lab environment. |
| Antibody speckling |
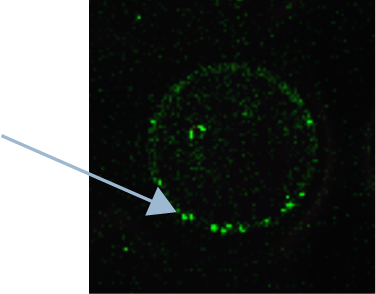
|
For best results, use freshly reconstituted antibody and ensure that your secondary antibody is not aggregating in solution. You may need to centrifuge the reconstituted secondary antibody solution to remove particulate. For IRDye Secondary Antibodies, follow reconstitution instructions in the pack insert. Pack inserts can be found on the Pack Insert Search page licorbio.com/packinsert. |
How Are Trim Values Calculated?
If you select Use trim value calculations in a Multiwell Plate Experiment workflow, the pixels with the highest and lowest 5% of pixel intensity values in each well will be excluded from the calculation of Total. The Total value is the sum of the individual pixel intensity values inside a region designated as a well in Empiria Studio.
Formulas that normally use Total will instead use the Total based on Trim Values. This includes the formula for calculating Signal for a well.
The formula for calculating Signal is:
Signal = Total - Background
Where:
Total is the sum of pixel intensity values for a well. If Use trim value calculations is selected, then the highest and lowest 5% of pixel intensity values are excluded from the calculation of Total.
Background is the average Total of background wells assigned to the Well Group. If Use trim value calculations is selected, then the highest and lowest 5% of pixel intensity values are excluded from the calculation of Total.
For more information about Well Groups and multiwell plate calculations in Empiria Studio, see Empiria Studio® Software Multiwell Plate Calculations Reference. For more information about calculations in Image Studio, see Calculation Descriptions.
When Should Trim Values Be Used?
The researcher must decide if it is appropriate to use trim values for a given analysis. Check with a statistician if you have questions.
The following points may be helpful to consider as you decide if using trim values is appropriate for your analysis.
-
Using trim values is probably helpful. Trim values will not matter much on a “clean” plate but will probably be helpful on a “dirty” plate. A “dirty” plate is contaminated with artifacts that could affect the results of the multiwell plate image analysis, such as motes of dust in a well that result in saturated pixels.
-
Be consistent about using trim values for analysis of replicate plates. Do not use trim values for analysis of some plates in a set of replicates but not others. Remember that using trim values helps on dirty plates but should not matter much for clean plates. When you plan to analyze replicate plate images, you may find it helpful to use trim values from the beginning to make it easier to be consistent about how you analyze the replicates.
-
Do not expect trim values to help if the plate is “too messy”. If a plate is “too messy”, the experiment may need to be repeated. For example, if more than 5% of the pixels in a well are saturated, Empiria Studio will not provide a quantification value.
-
Use trim values to remove saturated pixels. Saturated pixels cannot be quantified. Saturation can be caused by contamination etc.
When you report your data, be sure to mention if you used Trim Values. Empiria Studio provides indications when Trim Values are used in several locations, including a note on the Review and report page.
Why Is the Trim Value Option Provided in Empiria Studio® Software?
The option to use trim values is provided in Empiria Studio to limit the effect of outlier pixels on the results of multiwell plate analyses, in cases where outlier pixels would be a problem.
LI-COR has found that trimming 5% is high enough to remove most outlier pixels caused by contamination that can be expected (even on carefully prepared plates), without removing too many pixels.
The Trim Value option is available on the Quantify Wells page to ensure that it’s easily findable and selectable each time it is needed. Each plate that is part of a set of replicates must be analyzed the same way. The Trim Value option should be used to analyze all the plates in the replicate set or not used for analysis of any of the replicate plates.
Having a readily available Trim Value option helps ensure that the option is selected each time it’s needed and ensures that the same amount is trimmed each time. This helps ensure that multiwell plate analyses performed in Empiria Studio are reliable.
Calculating Z'-Factor with Different Trim Percentages
In this example, the Z’-Factor was determined with different percentages of pixels trimmed from the calculations. The Z’-Factor was determined in Empiria Studio using the [Preset] Z-Factor Determination 3 Plate Layout (provided with Empiria Studio).
Key finding: The Z’-Factor values are similar for all trim percentages, and the Z’-Factor value for 4% and 5% are the same. In this example, trimming more than 5% is unlikely to lead to better results and removing additional pixels could be counterproductive.
| Trim Percentage | Z'-Factor |
|---|---|
| Not trimmed | -0.0913 |
| 1% | 0.716 |
| 2% | 0.720 |
| 3% | 0.721 |
| 4% | 0.722 |
| 5% | 0.722 |
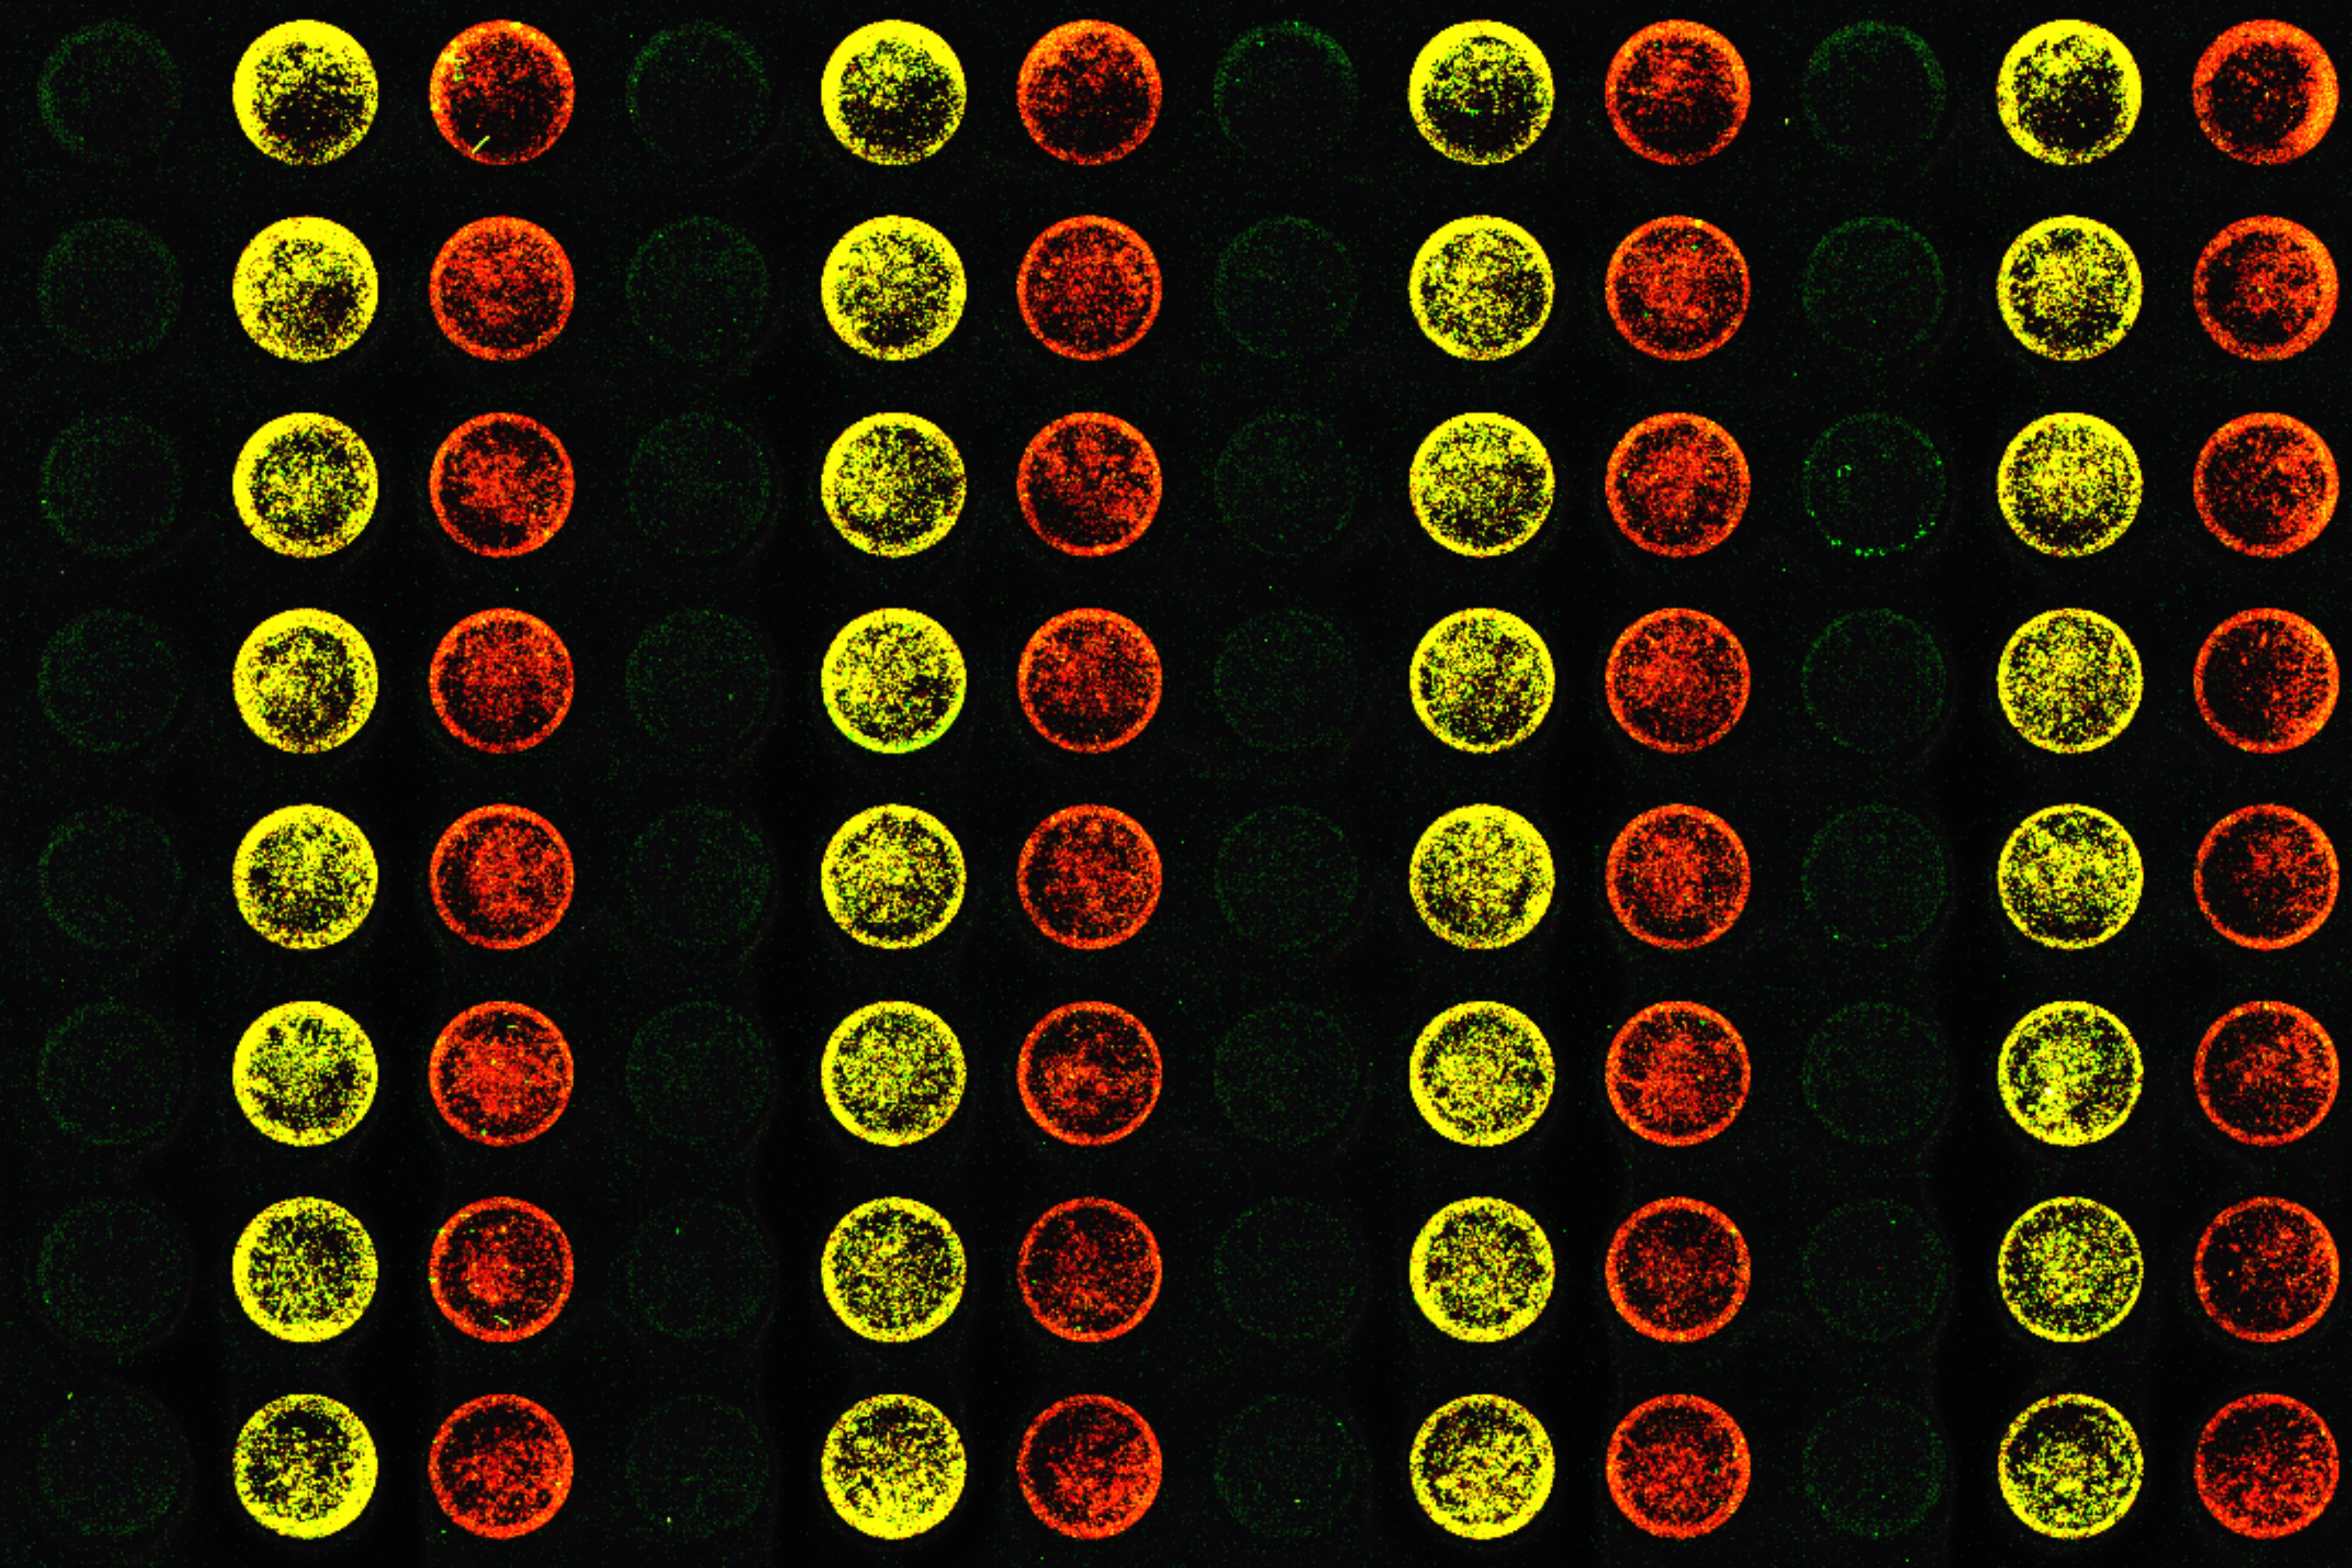
Calculating Z'-Factor for Contaminated Plate With and Without Trim Values
In this example, a Z’-Factor Analysis was performed in Empiria Studio on a plate image containing antibody speckling, dust contamination, and other unidentified contamination. The [Preset] Z-Factor Determination 1 Plate Template (provided with Empiria Studio) was used for analysis.
Key finding: The Z’-Factor calculated from the Trim Value data set was higher than the Z’-Factor from the non-trimmed data set.
| No Trimming | 5% Trim Value Option | |
|---|---|---|
| Z'-Factor | -2.45 | 0.379 |

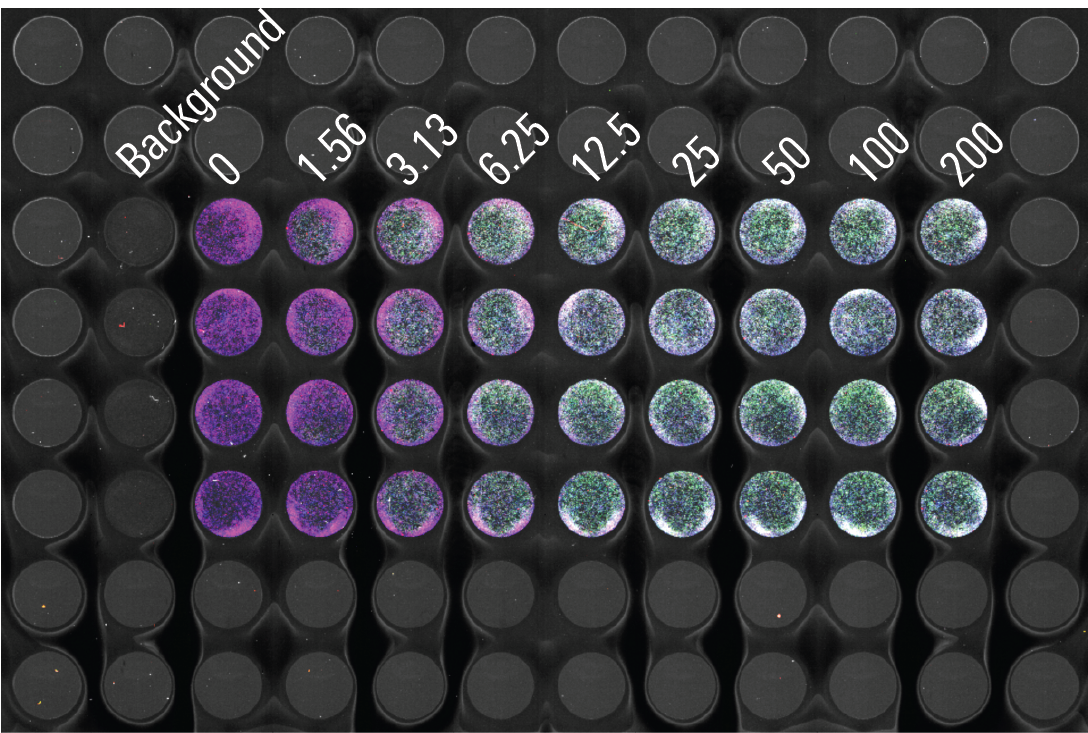
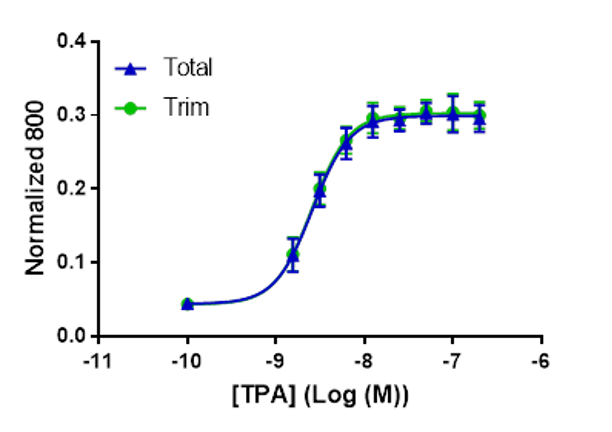
Calculating EC50 With and Without Trim Values
In this example, two EC50 values were calculated and compared. The first EC50 was calculated based on Trim Value data. The second EC50 was calculated based on data without trimming. For more information, see this example TPA Dose Response | In-Cell Western | pan-ERK1 and p-ERK1/2 from a sample In-Cell Western Example Assay Development Project.
Key finding: The difference between the two EC50 values was slight, underscoring that the Trim Value option is expected to have minimal effect for data from multiwell plates that have minimal contamination or no contamination.
| No Trimming | 5% Trim Value Option | |
|---|---|---|
| EC50 | 2.59 nM | 2.56 nM |
How Do I Get Trim Values in Empiria Studio?
If needed, this is how you can get Trim Value data in a Multiwell Plate Experiment in Empiria Studio.
-
In a Multiwell Plate Experiment, go to the Quantify Wells page.
-
Select the Use trim value calculations option.
-
Click Analysis Table.
-
The title of the Analysis Table dialog is Trim Value Plate Analysis Table, indicating that the values shown in the dialog are based on Trim Values.
-
Click to export the data.
-
You can unselect the Use trim value calculations option and reopen the Analysis Table to see data that is not based on Trim Values.
-