Display
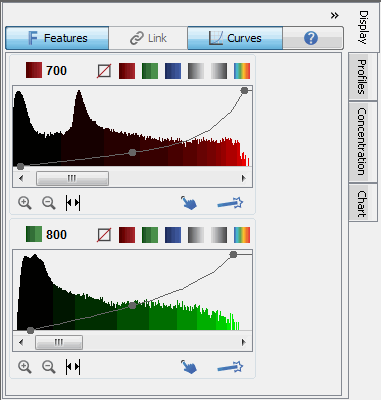
The Display panel allows you to edit the parameters that display the selected image in the image view. The Display panel has individual sections for each channel available on a given acquisition. This example shows the 700 channel in red and the 800 channel in green.
Features
Click the Features at the top left corner of the Display panel to toggle between displaying and hiding all features on the image. Features include Bands, Lanes, Wells, Spots, Annotations, and more. Select specific features to display or hide on the Show group in each Analysis tab.
Brightness and Contrast
You can adjust the display with the Brightness and Contrast sliders. Drag a slider to adjust the display.
You can also adjust the display using curves on a histogram. Click Curves on the top of the Display panel to open the Curves tab.
You can also click the arrow (>) in the Display group on the Image tab to open a dialog and choose Curves to view the Curves for this image. Select Brightness/Contrast to view the Brightness and Contrast sliders again.
Curves
The x-axis of each panel represents the raw pixel values. Each panel has a bar graph displaying a histogram of number of pixels with each raw value. The higher the bar at a given location on the x-axis, the more pixels that contain that particular intensity value. This histogram is shaded with the color map in use for that channel. Also shown in each panel is an adjustable curve that maps raw data to displayed data.
The adjustable curve overlaying each histogram represents how the raw data maps to the displayed data. Adjust any of the three dots on the line (Max, Min, or K Value) to optimize the displayed image.To view the numbers hover the mouse over one of the three dots in the line. The Max and Min numbers are displayed. The middle one also shows the K value, which is used to smoothly change between linear (K=0) and logarithmic (K=1) mappings of the data onto the color maps.
- Moving the Max Point to the left is similar to increasing the Contrast value in the Odyssey software. As more of the intensity values are mapped to the brightest display values, the bands become brighter.
- Moving the Min Point to the right shades more of the lower intensity values to lower display values, creating a visually cleaner background.
- Increasing the K value reduces the contrast between the higher and lower intensity values, so less intense bands appear brighter while very bright bands are avoided.
Adjusting the Parameters
You can adjust each channel’s display parameters independently.
-
 Use the Channel label to cycle through channel
views. Press once to show the single channel. Press again to show the
other channels.
Use the Channel label to cycle through channel
views. Press once to show the single channel. Press again to show the
other channels. -
 Use the disable button to disable (gray
out) the channel. This is necessary when you are adding shapes.
Use the disable button to disable (gray
out) the channel. This is necessary when you are adding shapes. -


 Use the color buttons
to change the channel’s display color.
Use the color buttons
to change the channel’s display color. -

 Use
the gray scale buttons to display the channel in gray scale. This is useful
for displaying the image for reports that will be published.
Use
the gray scale buttons to display the channel in gray scale. This is useful
for displaying the image for reports that will be published. -

 Use
the zoom buttons to zoom in on the range of pixel values for the channel.
Use
the zoom buttons to zoom in on the range of pixel values for the channel. -
 Use the expand button to show the full histogram
in full zoomed out view. Use the zoom in button to zoom back incrementally
or the automatic button to zoom in all the way.
Use the expand button to show the full histogram
in full zoomed out view. Use the zoom in button to zoom back incrementally
or the automatic button to zoom in all the way. -
 Use the Choose Display button to select the best display from six choices. See Choose Display for more information.
 -
 Use the Adjust Display button to open a dialog to help you set the min and max points of the display mapping. See Adjust Display for more information.
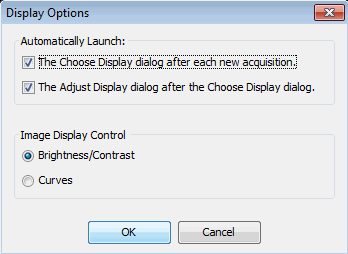
The Choose Display and Adjust Display dialogs automatically open after a scan for each channel acquired. Click the arrow (>) in the Display group to open the Display Options dialog and remove the check marks to disable this feature.
Link Image Display Values
Link lookup tables (LUTs) when you need to compare images directly. A shared LUT keeps display mapping consistent across images so visual differences reflect the image data, not different display settings.
When LUTs are linked, all changes to Curves or Brightness/Contrast then apply to every filtered image (in single-image or multi-image view).
The Image Display values will differ depending on instrument and acquisition settings. For accurate comparisons, link only images from the same instrument and acquisition settings.
To link LUTs:
-
In the Images table, select the image acquisitions that you want to compare.
You can use CTRL + Click (⌘ + Click on macOS) or SHIFT + Click to select the acquisitions.
-
Filter to those acquisitions by clicking Filter > Selection, or press Ctrl + J.
-
In the Display panel, click Link.
A filter must be applied to the Images table for the Link button to be available.
Link View
Link View helps compare similar acquisitions by keeping the same zoom level and the same part of each image in view. This is useful when reviewing the same well in multiple plate images, or the same region across multiple acquisitions.
-
Select the acquisitions that you want to compare in the Images table.
-
Filter the table to the selected acquisitions.
-
Click Image > Link View.
-
Zoom one linked acquisition to update the other filtered acquisitions to the same view.
You can use Link View together with linked display values so the acquisitions stay easier to compare.