Morphology Analysis Workflow
Morphology analysis in Image Studio refers to a collection of flexible tools for identifying shapes in an image, counting shapes, and making morphological measurements of the shapes.
The Morphology Analysis in Image Studio can be used for a variety of assays and measurements, so the information in this topic is intended only as starting points to show how the tools in the Morphological Analysis can be used.
If you are new to morphological analysis, please consider starting with the concepts and further reading links in the Morphology Analysis Concepts topic.
Generalized Workflow
Morphology analysis is generally comprised in phases, with tools for each phase provided from left to right on the Morphology Analysis ribbon.
Phase 1: Define the Part(s) of the Image to Analyze
Often, a scan will have artifacts that do not need to be analyzed and/or may contain multiple samples. If you do not want to analyze an entire image, you have multiple options for defining a smaller image or area for analysis.
-
Crop the image - You can use the Image ribbon > Crop option to crop images into separate acquisitions for analysis.
-
Define areas of interest on the image - Standard shape drawing tools are included in the Morphology Analysis ribbon for drawing elliptical, rectangular, or freehand Areas of Interest (AOI). AOIs can also be generated automatically with tools described below. When toggled appropriately, regions inside an AOI will be included (called an "inclusion AOI") or will not be included (called an "exclusion AOI") when finding shapes. Not using an AOI shape will simply include the full image.
Phase 2: Generate Shapes
The following instructions show two options for generating shapes. (If needed, generated shapes can be made into inclusion or exclusion AOIs as described in the prior phase.)
-
In the Display panel, display only one channel.
Generally, it is a best practice to adjust the Lookup Table Sliders to be the same for all images with a given channel in an experimental set, but needs can vary based on experimental details.
-
There are currently two options for how to generate shapes.
-
Option 1: Manually set an upper and/or lower threshold pixel intensity using the a Custom Threshold analysis. In this workflow, you will inspect the image to find the upper and/or lower pixel intensity threshold that separates the features you want to analyze from the image background. You will use these thresholds to create an image mask, and contours will be generated around the features based on the mask. If needed, Opening and Closing parameters can be used to refine feature detection.
-
Option 2: Generate shapes based on adaptively determined thresholds using Auto Detection. This method will subtract background noise based on the Erosion Size or Subtraction Constant (typically only one is used, although it is possible to use both in conjunction), then use Otsu's method to find a threshold for each square tile of the size indicated in Threshold Neighborhood. Setting the Threshold Neighborhood to the size of the greatest dimension of the image is effectively equivalent to using a simple automatic threshold detection.
Tip: You can easily view the height and width of the image by adding columns to the Morphology Shapes table. Click Columns above the Morphology Shapes table and select Image Height (px) and Image Width (px) to add those columns to the Morphology Shapes table.
-
Phase 3: Refine Generated Shapes (if Needed)
After generating shapes, you may find that the objects are undersegmented, meaning that some objects that should be separate are joined. To account for this, the Refine Shapes group provides the Watershed option. Generally, it is designed to be used with either erosion or distance transform based foreground thresholding, not both. It can mathematically use both, but generally is not done in practice. Eroding the mask, or calculating the distance transform and selecting a smaller portion of it based on a threshold, generate a known foreground. Dilation generates known background locations, and then the valleys between unknown regions are calculated. This operation works on currently showing shapes. This means if run multiple times in a row, the originally found shapes will be run through the watershed algorithm, and subsequent runs will operate on the previous result of the watershed algorithm.
Exporting Data
Click Export Summary Data to export a spreadsheet with the option of having data in physical units (mm, um, and cm) instead of pixels.
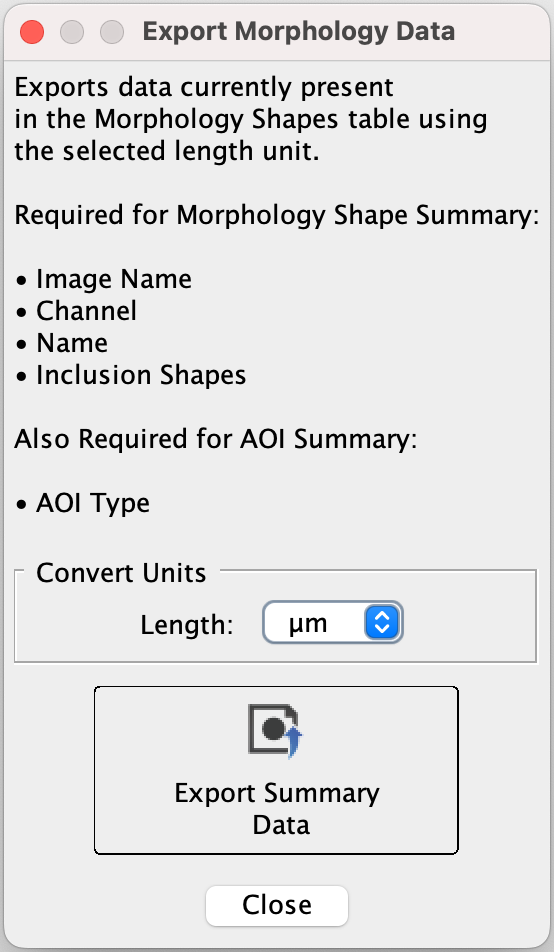
Ensure all the necessary columns (listed in the dialog) are in the Morphology Shapes table. If any are missing, click Columns (near the lower right corner of the Image Studio window) and choose the columns to add.
To export physical units instead of pixels, choose the unit you want in the Length list and then click Export Summary Data. Supported physical units are mm, um, and cm. When you are done exporting data, click Close.
To export data from multiple replicate analyses in a Work Area, click Filter and uncheck Display Current.

Morphology Analysis Examples
Example 1 Measure Area of a Spheroid in a Brightfield Individual Well Image from the LICORbio Atlas™ Imager
This tutorial is an example to show the flexibility of the Morphology Analysis tools. Your analysis will need to be adjusted to meet the needs of your research.
| Goal | The goal of this analysis is to measure the Area of a spheroid. |
| Inputs | A brightfield image (630 Trans) was acquired of an individual well from a 96-well plate at 5 µm resolution using the LICORbio Atlas™ Imager. |
| Process Overview | This example will identify an area around the spheroid as an Area of Interest (AOI) and then mask the spheroid so that a contour can be drawn around the spheroid and the spheroid's Area can be measured. |
-
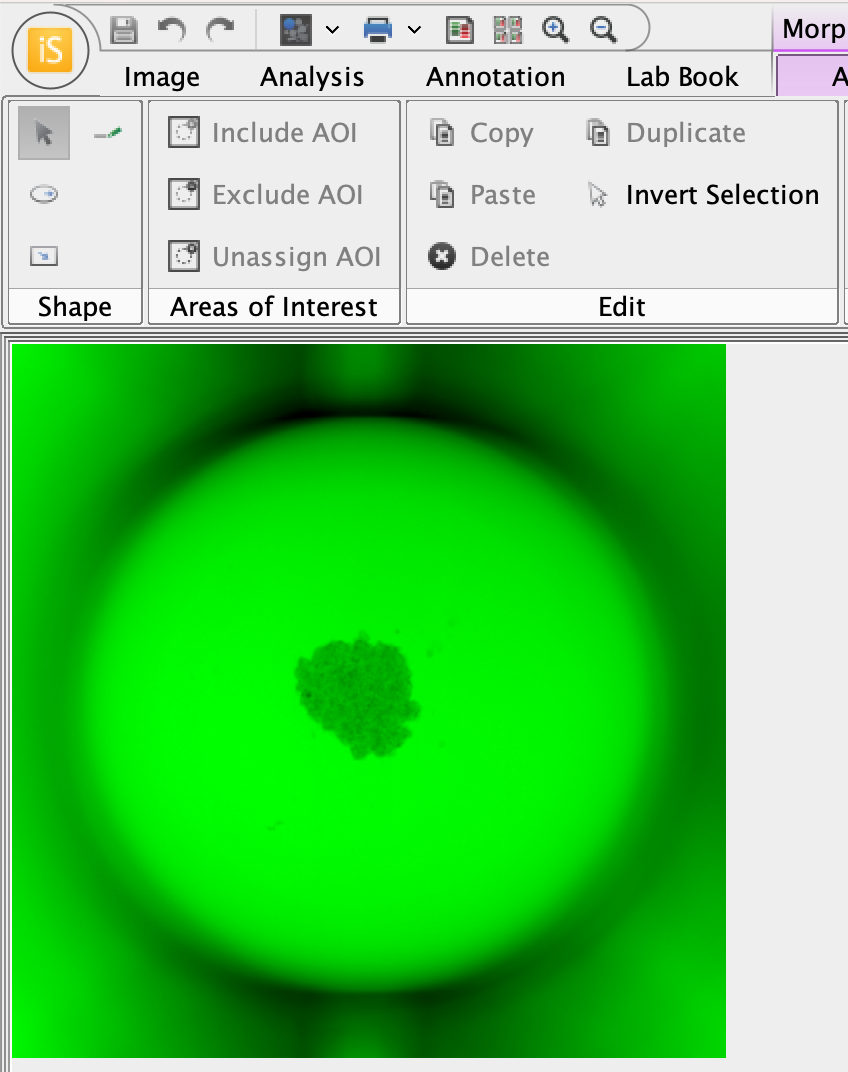
In the Display panel, choose a bright color that can be seen easily.
The image mask pixels are gray. It will help to be able to visually contrast the areas indicated by the image mask against the original image.
The well image in a bright color will look something like this.
-
Apply a Morphology Analysis (Analysis ribbon > Manual > Morphology).
-
In Morphology Analysis > Shape group, click Draw Ellipse.
You will draw an ellipse around the spheroid to use as an Area of Interest. The Area of Interest will limit where shapes are found in the image to limit unneeded objects from being detected.
-
To draw a circle around the spheroid, click into the center of the spheroid, then left-click and drag the cursor away from the spheroid until the circle encompasses the spheroid.
If you want to draw a perfect circle around the spheroid, hold down the SHIFT key while clicking and dragging the cursor.
-
To exit drawing mode, press ESC or click Select in the Morphology Analysis ribbon.
-
With the ellipse you just drew selected, click Include AOI.
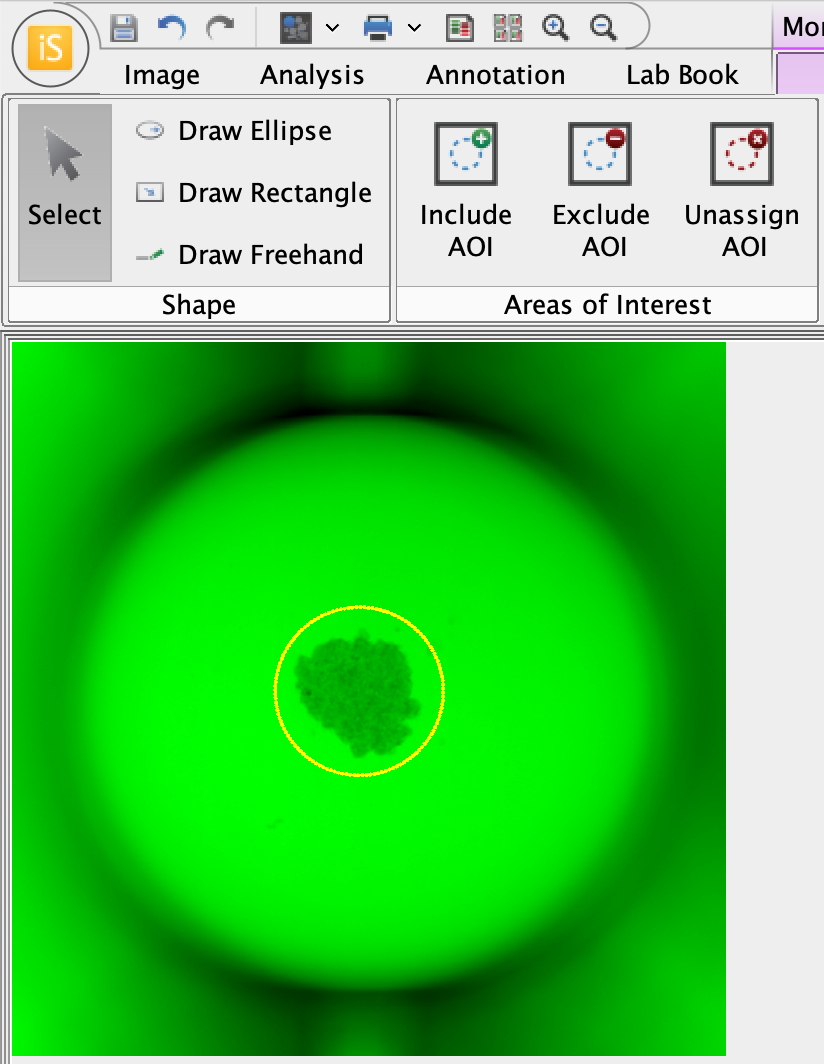
Now that the ellipse around the spheroid is assigned as an AOI, only objects within the ellipse (i.e., the spheroid in this example) will be detected. -
You will need to determine which pixel intensity to use as the threshold to mask the spheroid. Point your cursor to the center of the spheroid and notice that the pixel intensity at the location of your cursor is shown in the lower right of the Image Studio window.The pixel intensity changes as you move your cursor.
Find a representative pixel intensity for within the spheroid. This will be a starting point for setting the mask threshold.
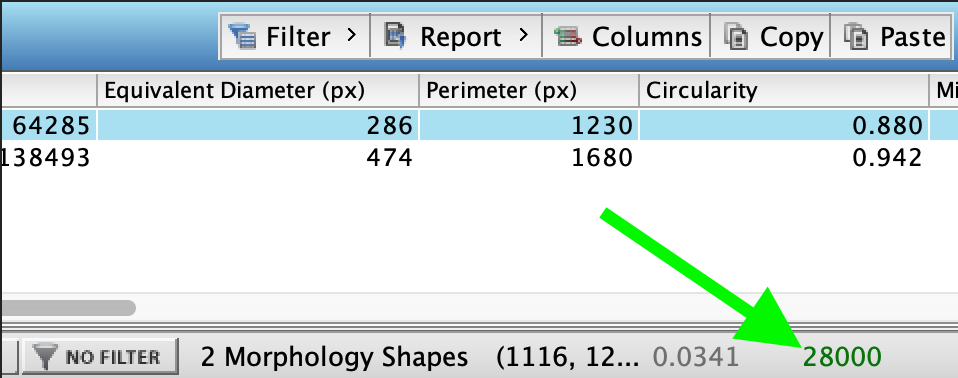
The pixel intensity is shown in the lower right corner of the Image Studio window. The pixel intensity text is shown in the same color as the display color for the image channel. -
In the Custom Thresholds group, click Threshold Detection.
-
In the Threshold Detection dialog, enter a pixel value in the text field for the Upper threshold or adjust the Upper threshold slider. Continue adjusting until the gray pixels of the mask cover the spheroid inside the AOI.
Especially for clear walled plates, there may be regions outside the AOI that are also included in the mask, but regions outside the AOI will not be detected.
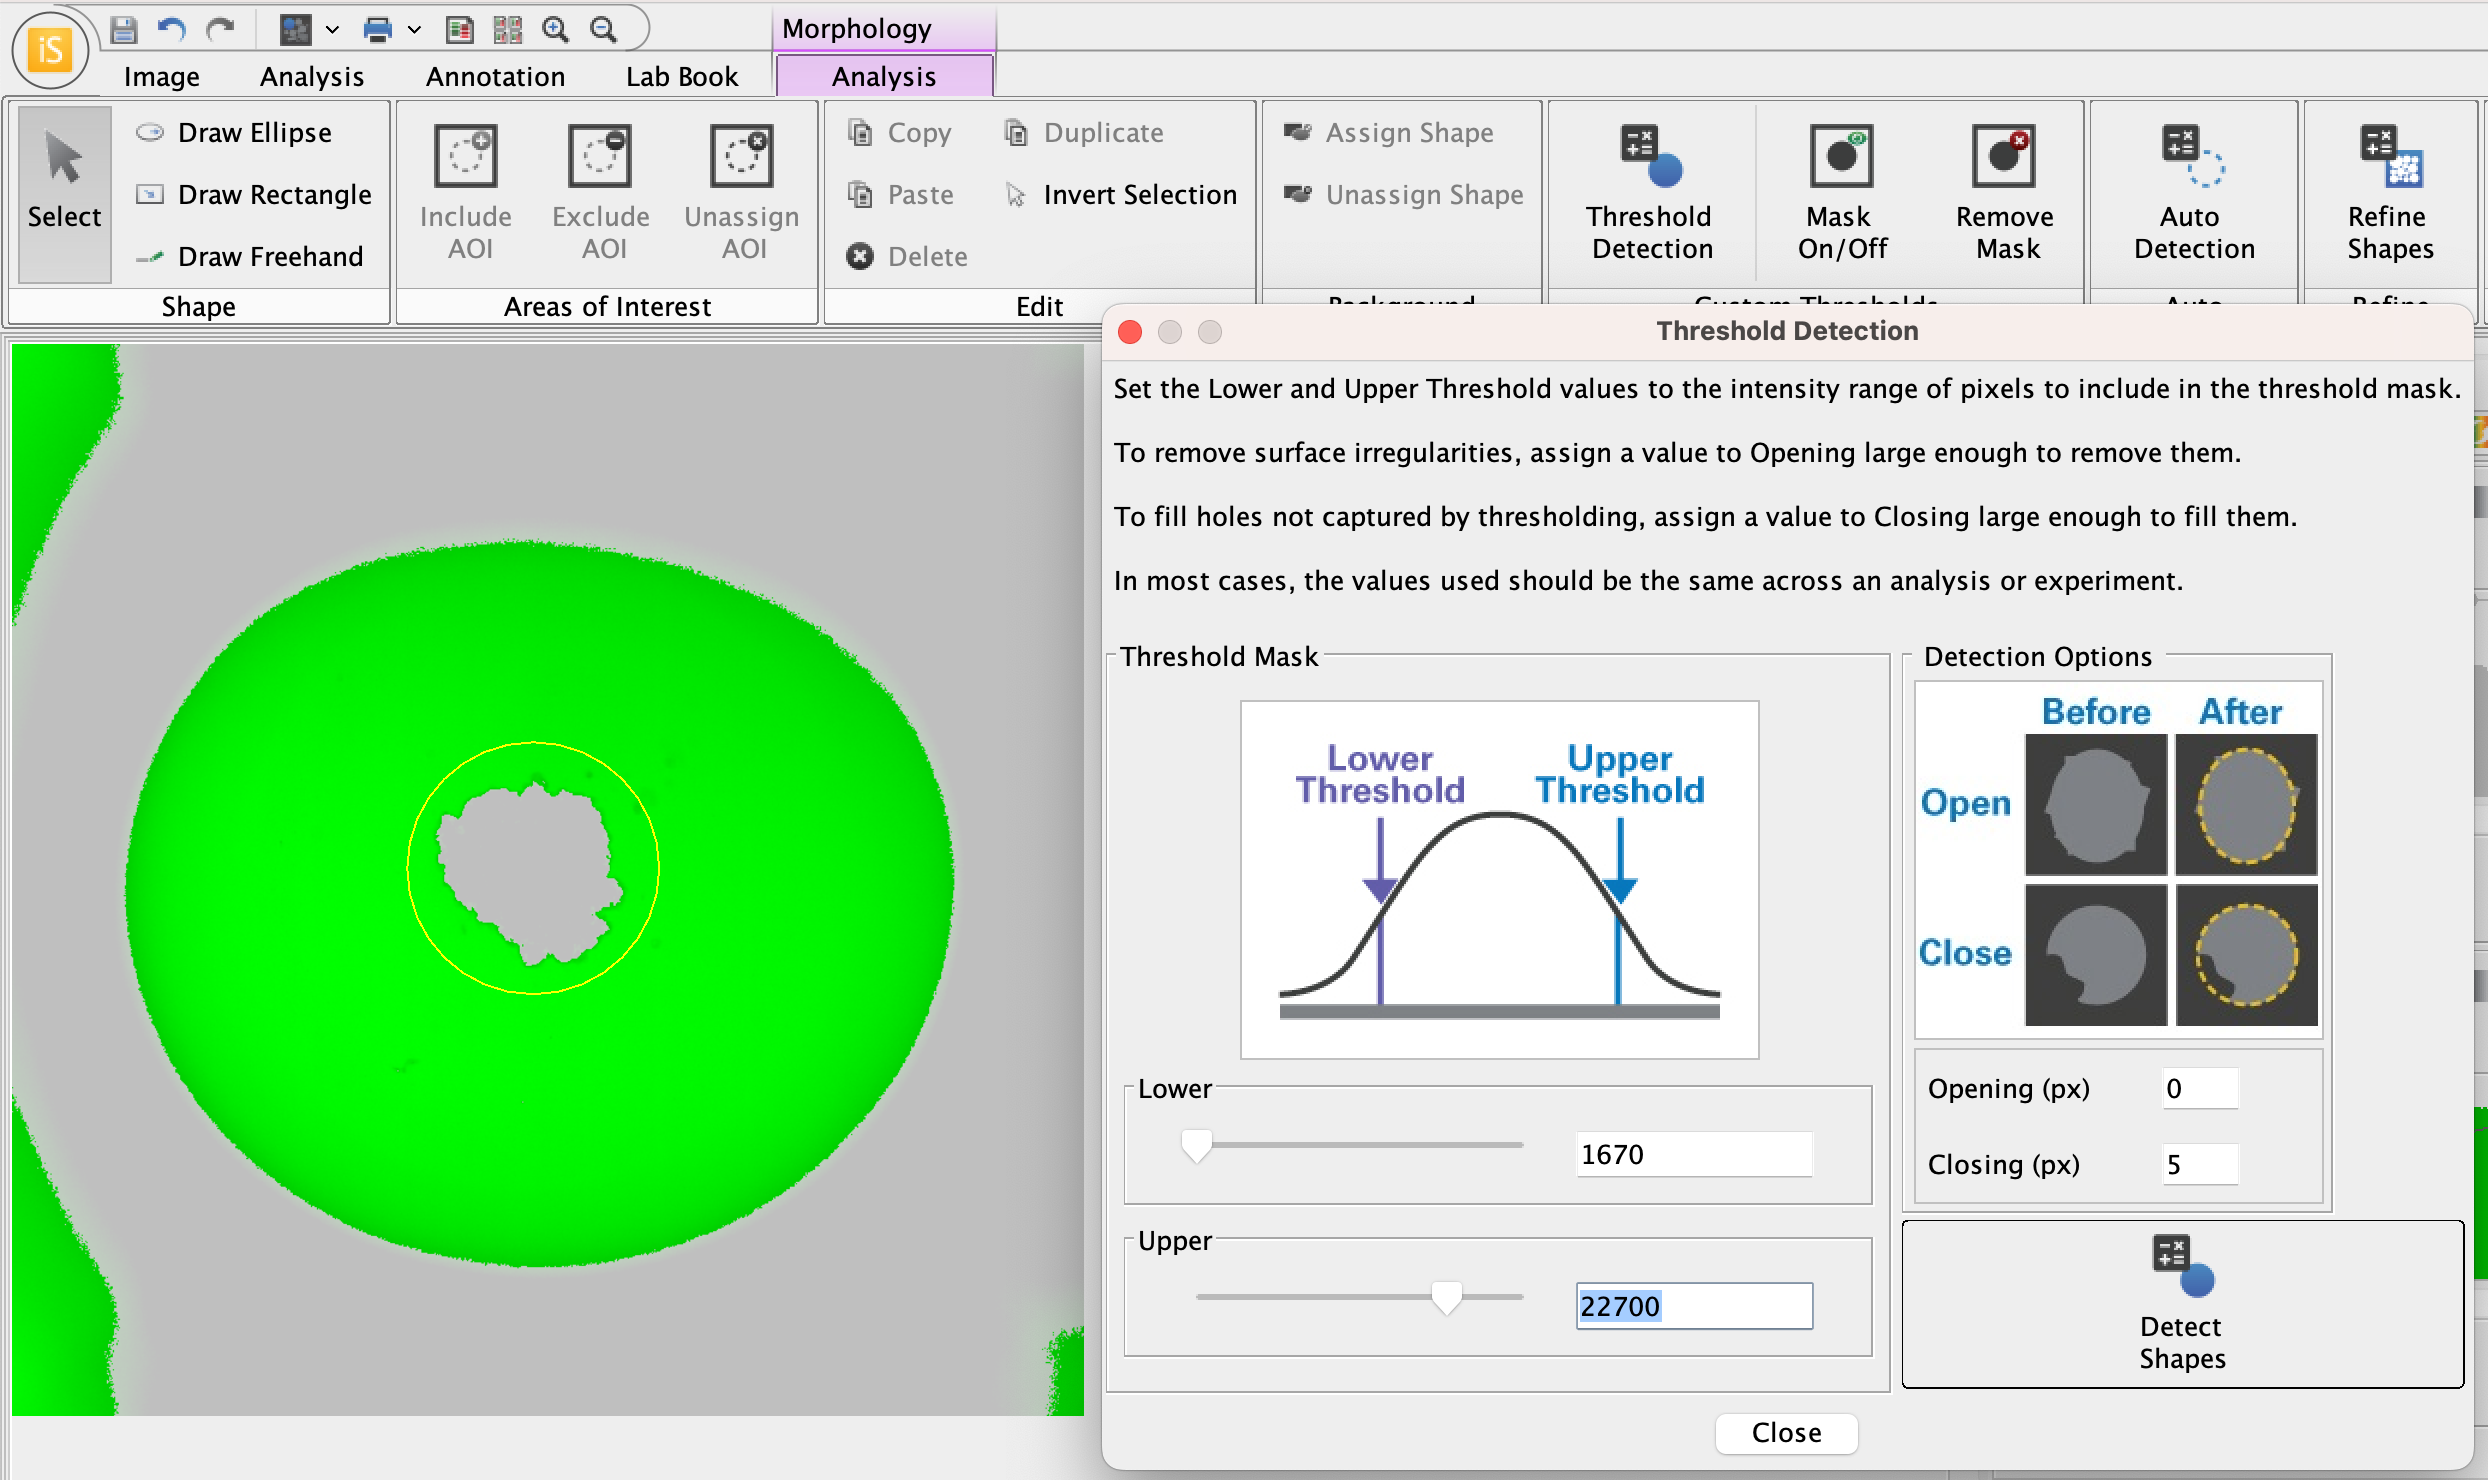
Now that the ellipse around the spheroid is assigned as an AOI, only objects within the ellipse (i.e., the spheroid in this example) will be detected. -
Once the mask covers the spheroid, click Detect Shapes in the Threshold Detection dialog. The spheroid with a contour drawn around it will look something like this.
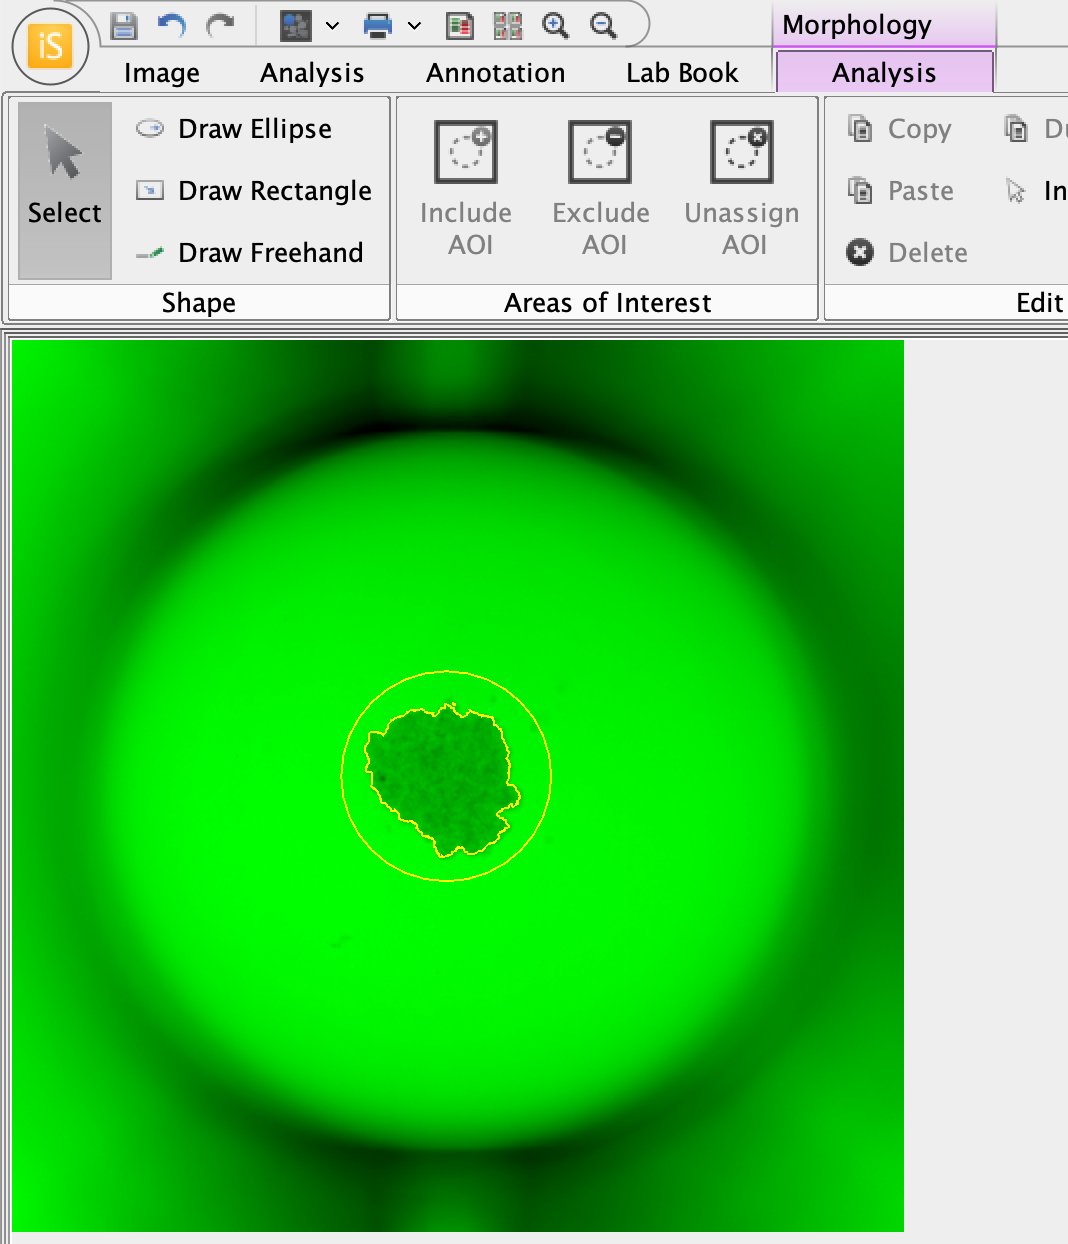
-
In the Morphology Shapes table, notice that the Area is shown in pixels.

-
If there are extra, unneeded shapes, you can delete them or filter them out of the table according to the criteria needed for your analysis. Right click table headers for filter options.
-
Click Columns to view additional measurements that are available to add to the Morphology Shapes table.
-
Click Export Summary Data in the Morphology Analysis ribbon to export Area in length units (µm, mm, cm).
-
Example 2 Measure Area of Spheroids in a Brightfield Image from the LICORbio Atlas™ Imager
This tutorial is an example to show the flexibility of the Morphology Analysis tools. Your analysis will need to be adjusted to meet the needs of your research.
| Goal | The goal of this analysis is to measure the Area of spheroids. |
| Inputs | A brightfield image (630 Trans) was acquired of a 96-well plate on an LICORbio Atlas™ Imager. |
| Process Overview | This example will generate shapes around wells, then assign the shapes generated around wells as inclusion AOIs (Areas of Interest), then identify and measure Area of spheroids within each well. |
-
In the Display panel, choose a bright color that can be seen easily.
The image mask pixels are gray. It will help to be able to visually contrast the areas indicated by the image mask against the original image.
The plate image in a bright color will look something like this.
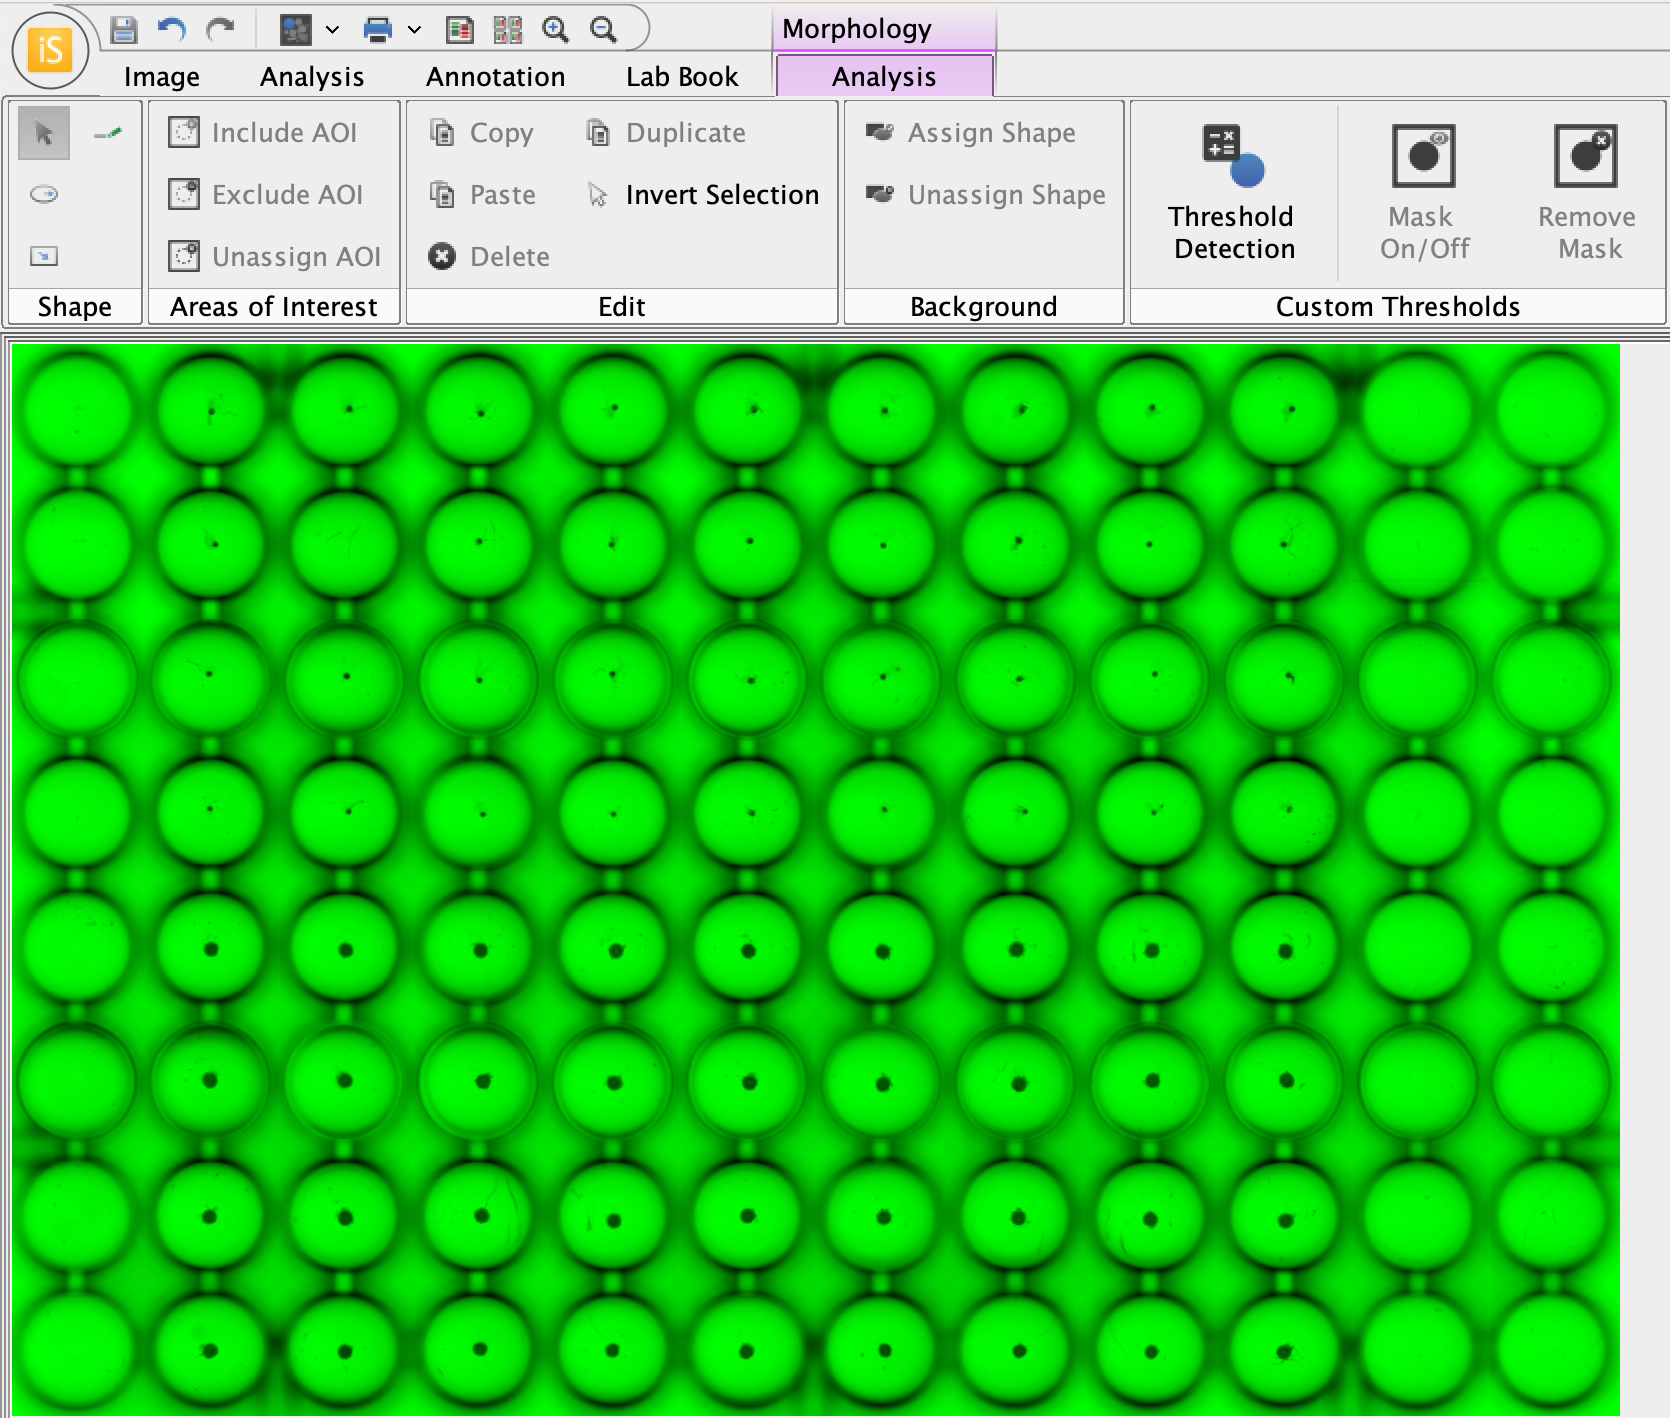
-
Apply a Morphology Analysis (Analysis ribbon > Manual > Morphology).
-
In the Morphology Analysis ribbon, in the Custom Thresholds group, click Threshold Detection. Adjust the Lower and Upper threshold sliders until the background area within the wells is identified by the image mask (gray pixels).
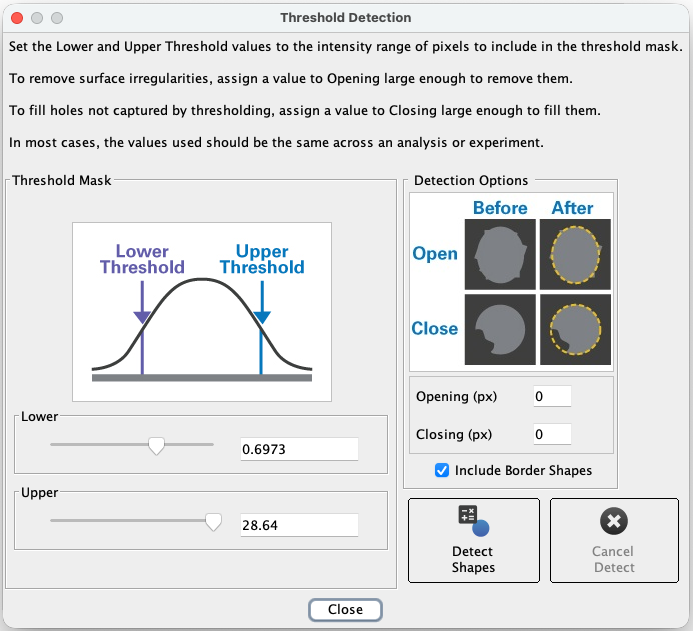
This is the Threshold Detection dialog. Tips
-
Point your cursor over the image, and the pixel intensity at the location of your cursor will be displayed (see the lower right corner of the Image Studio window). Using this method to inspect pixel intensities will allow you to quickly assess the pixel intensities of the well background and background between wells, which will provide a good starting point for finding the right threshold to mask the wells.
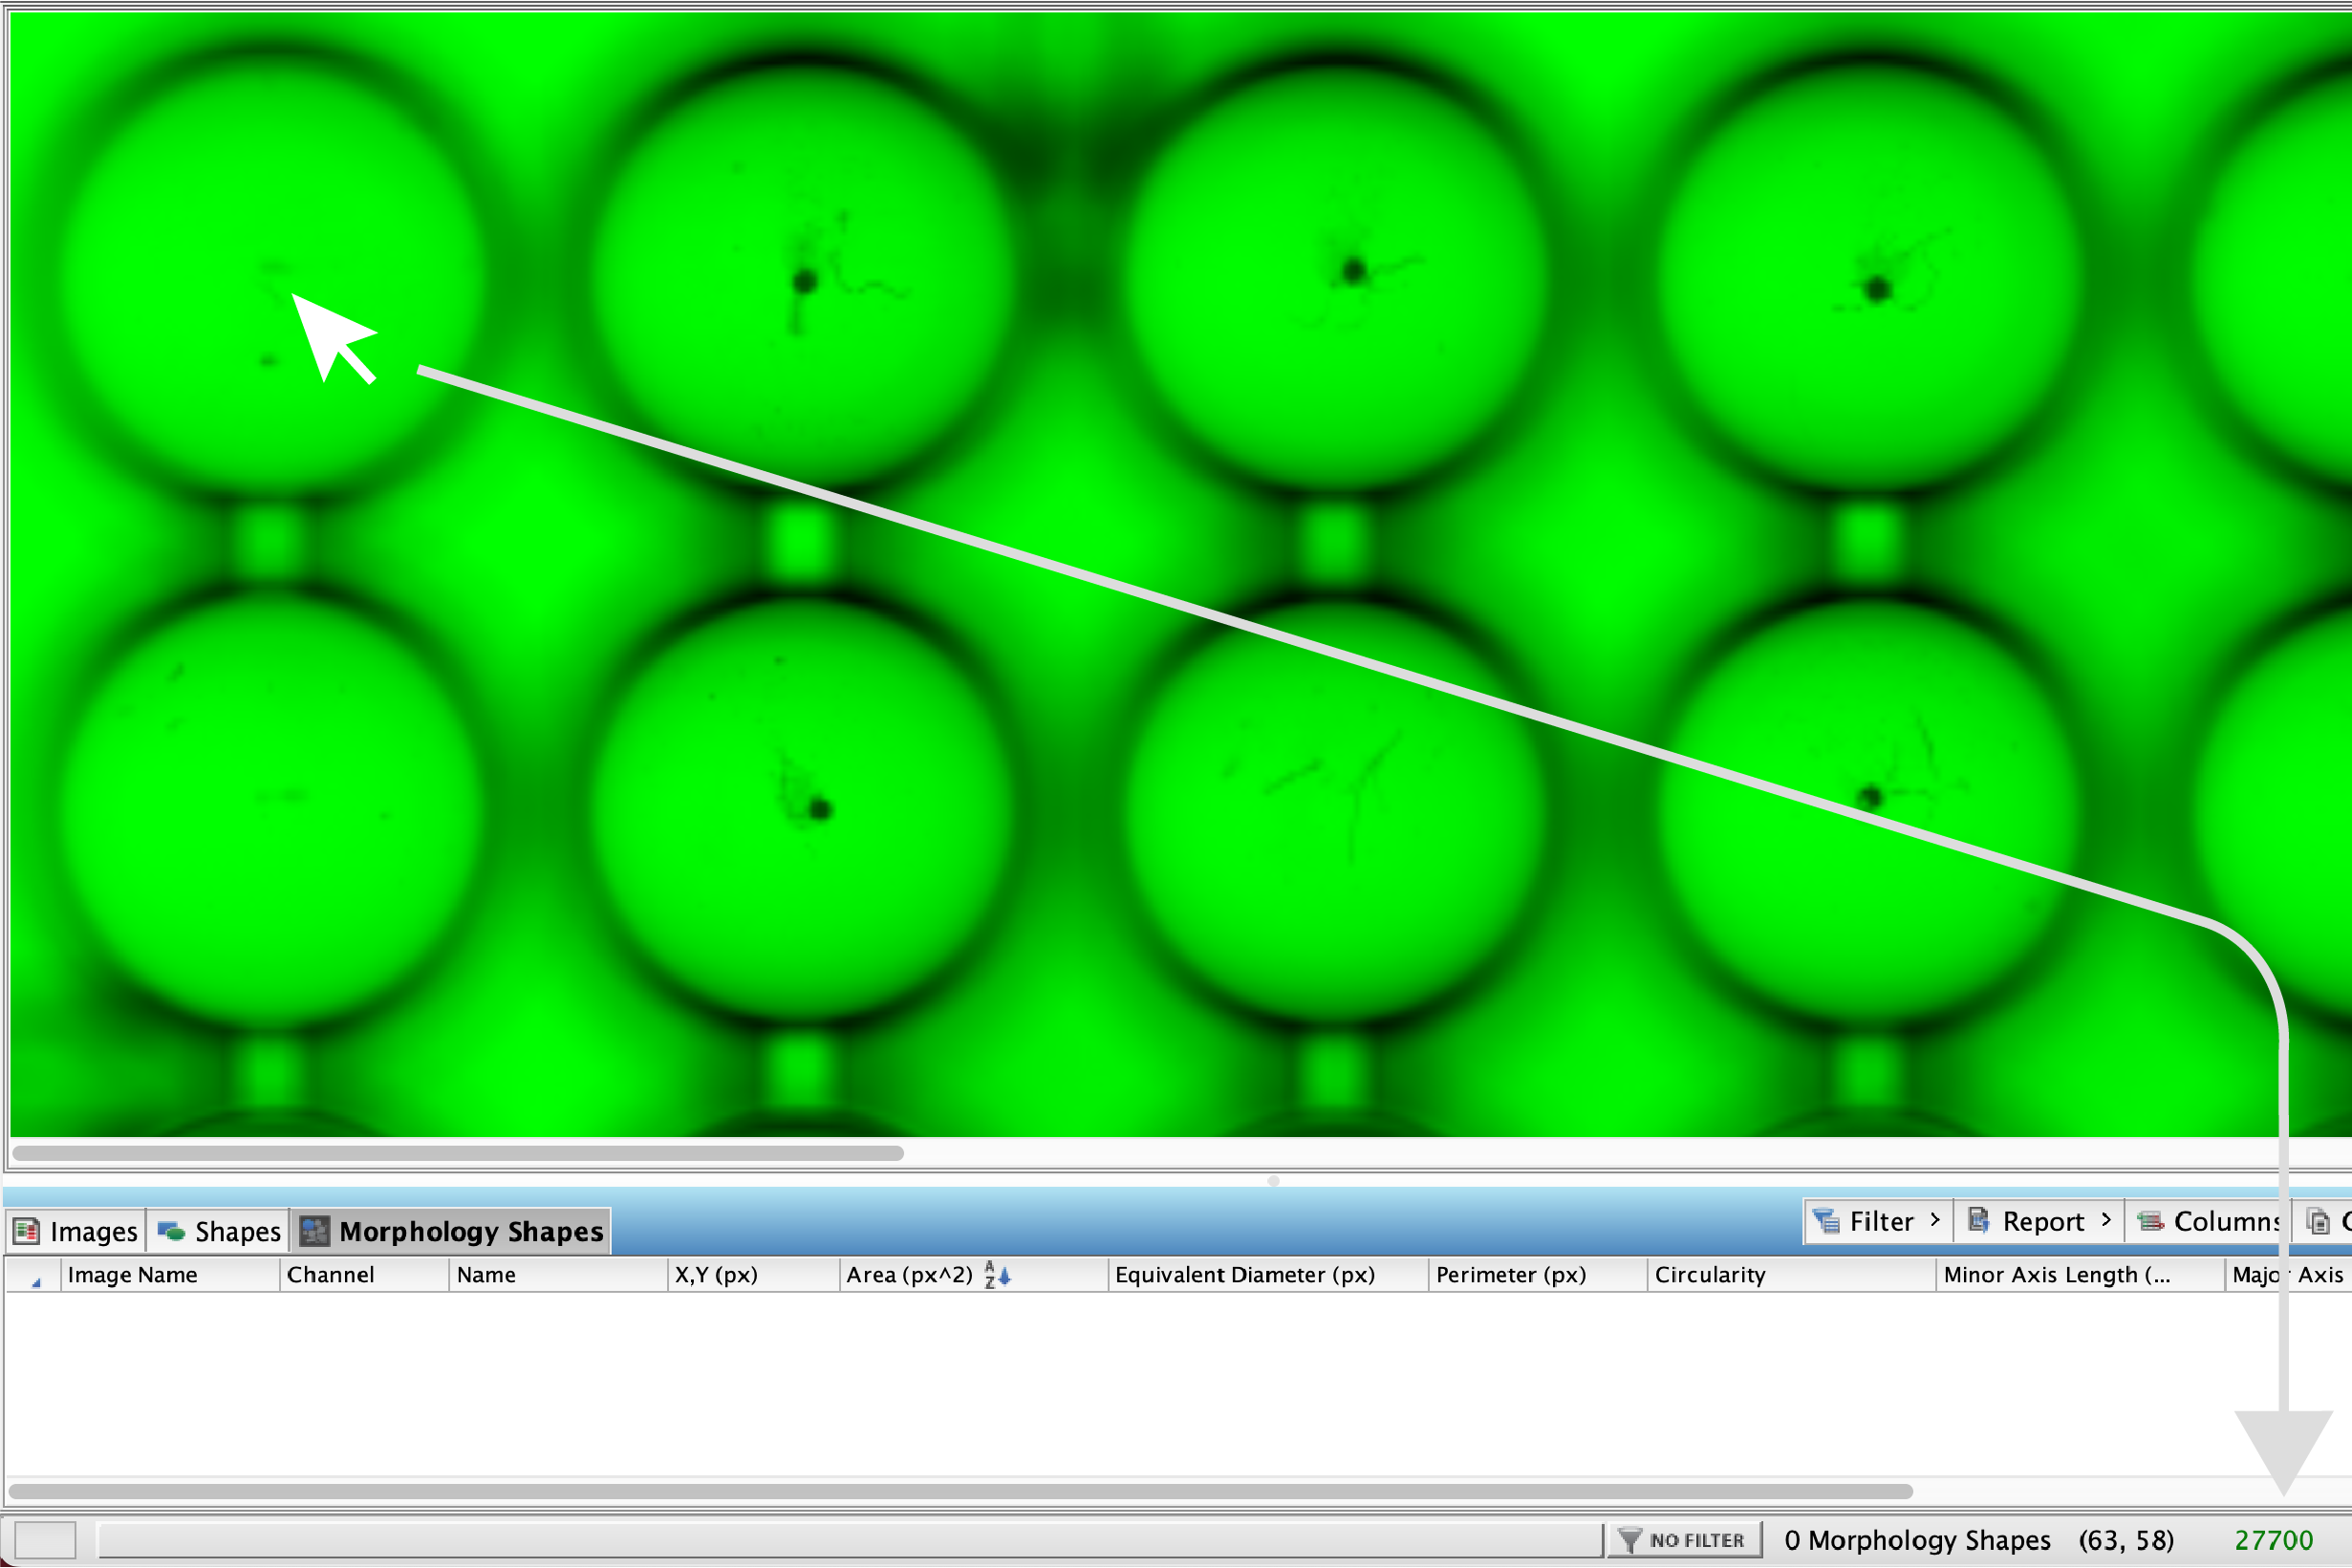
The pixel intensity at the cursor's location is displayed in the lower right corner of the Image Studio window. -
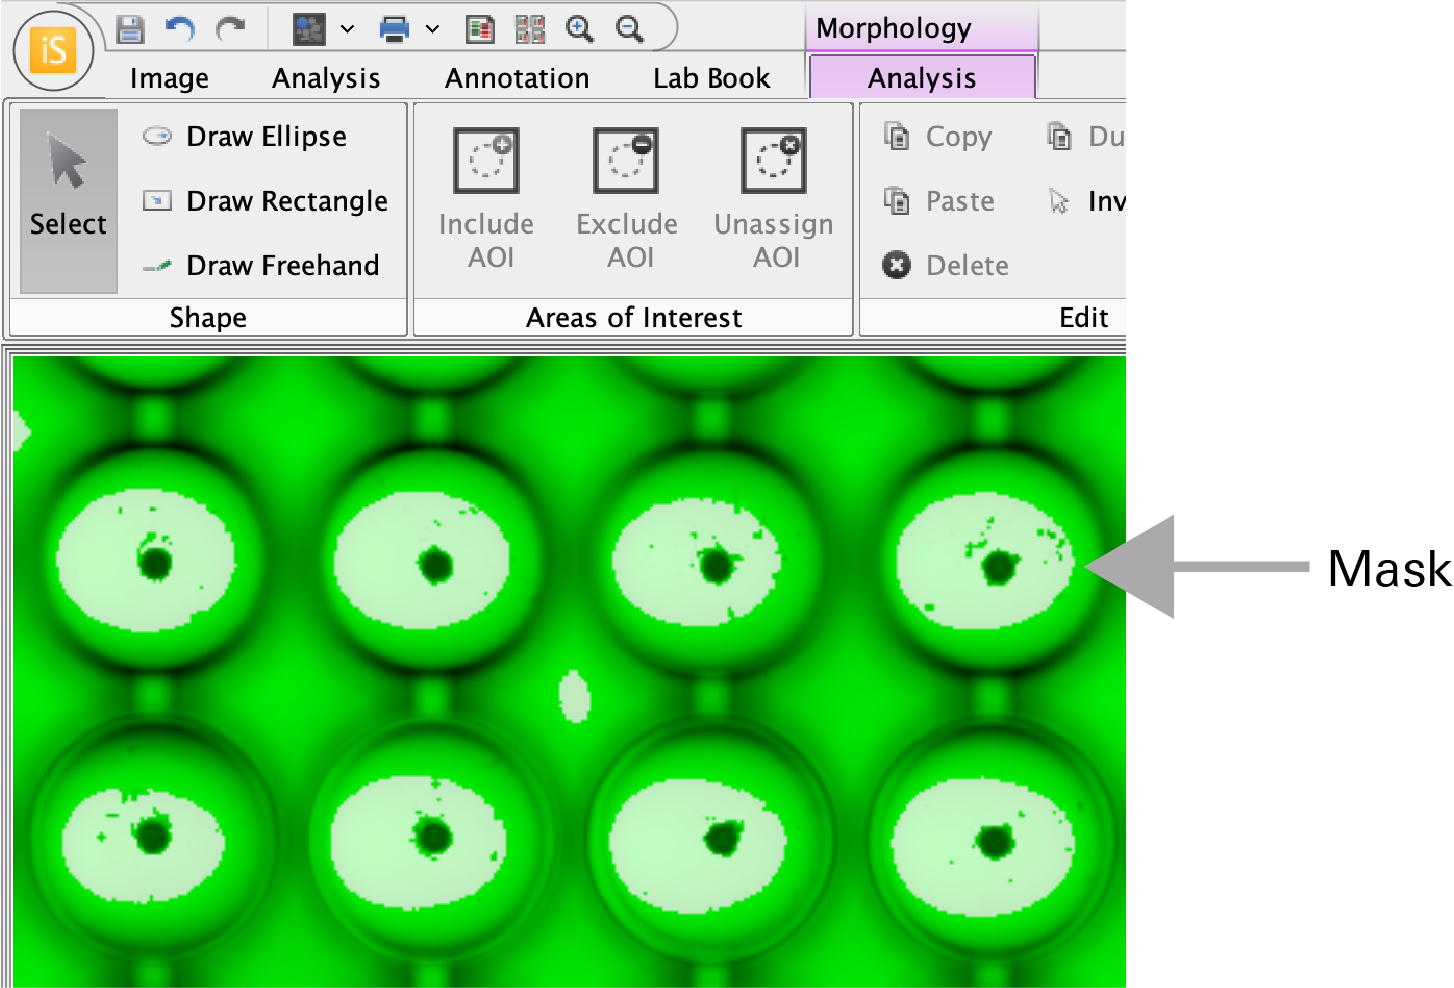
Do your best to minimize inter-well background identified by the mask, but analysis can still proceed with some inter-well background.
When thresholds are set to mask the wells, the image with the mask should look something like this.
-
-
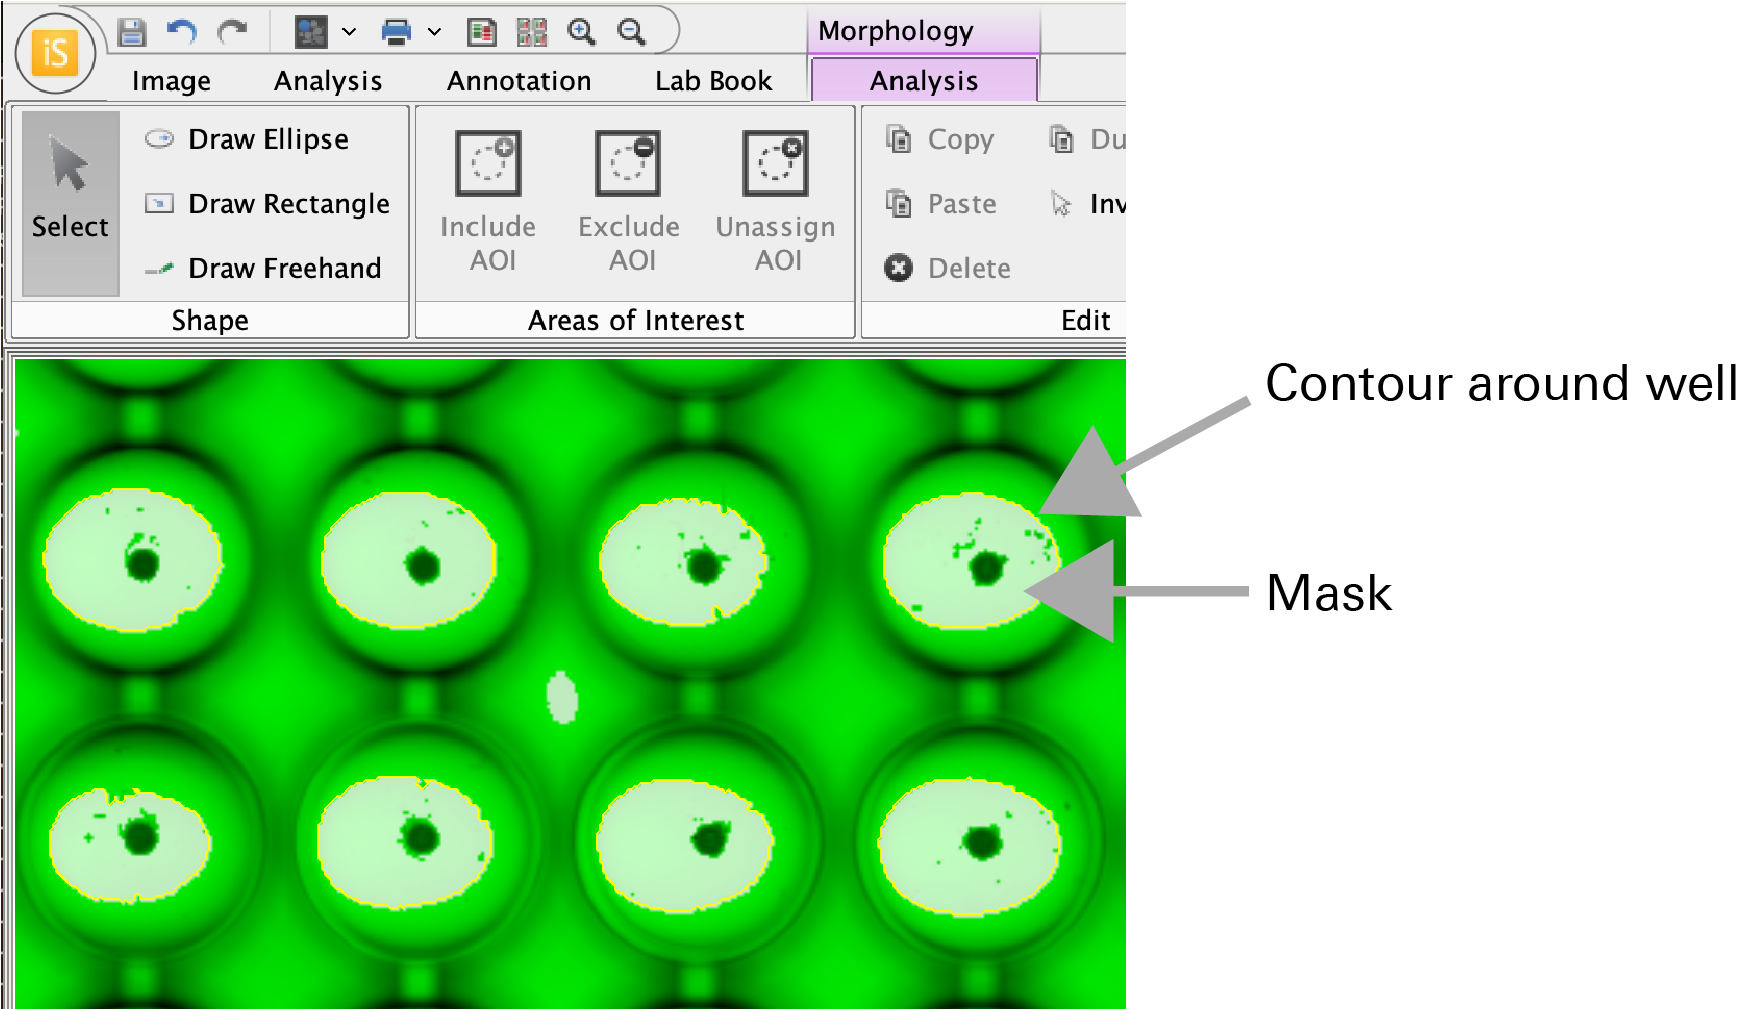
When the mask clearly indicates wells, click Detect Shapes in the Threshold Detection dialog.
Shapes will be generated around the wells. Shapes will also be generated around some inter-well background areas, but your analysis can probably proceed. If needed for your analysis, you can consider selecting the inter-well areas (e.g., click and drag) and deleting them.
-
Press CTRL + A (CMD + A on macOS) to select all the generated shapes.
-
In the Areas of Interest group, click Include AOI.
Designating these shapes as AOIs will enable spheroids to automatically be found within each well and will prevent false positive shape generation outside of wells.
AOIs are indicated with
(i)after the label number. Label numbers on shapes can be toggled off by unselecting Labels in the Analysis ribbon > Show group. -
In the Thresholding group, adjust the Lower and Upper thresholds so that the spheroids within each well are identified by the mask.
Remember, now that the well shapes have been designated as inclusion AOIs, only masked areas within the AOI will be identified as shapes.
-
In the Thresholding group, click Threshold Shapes.
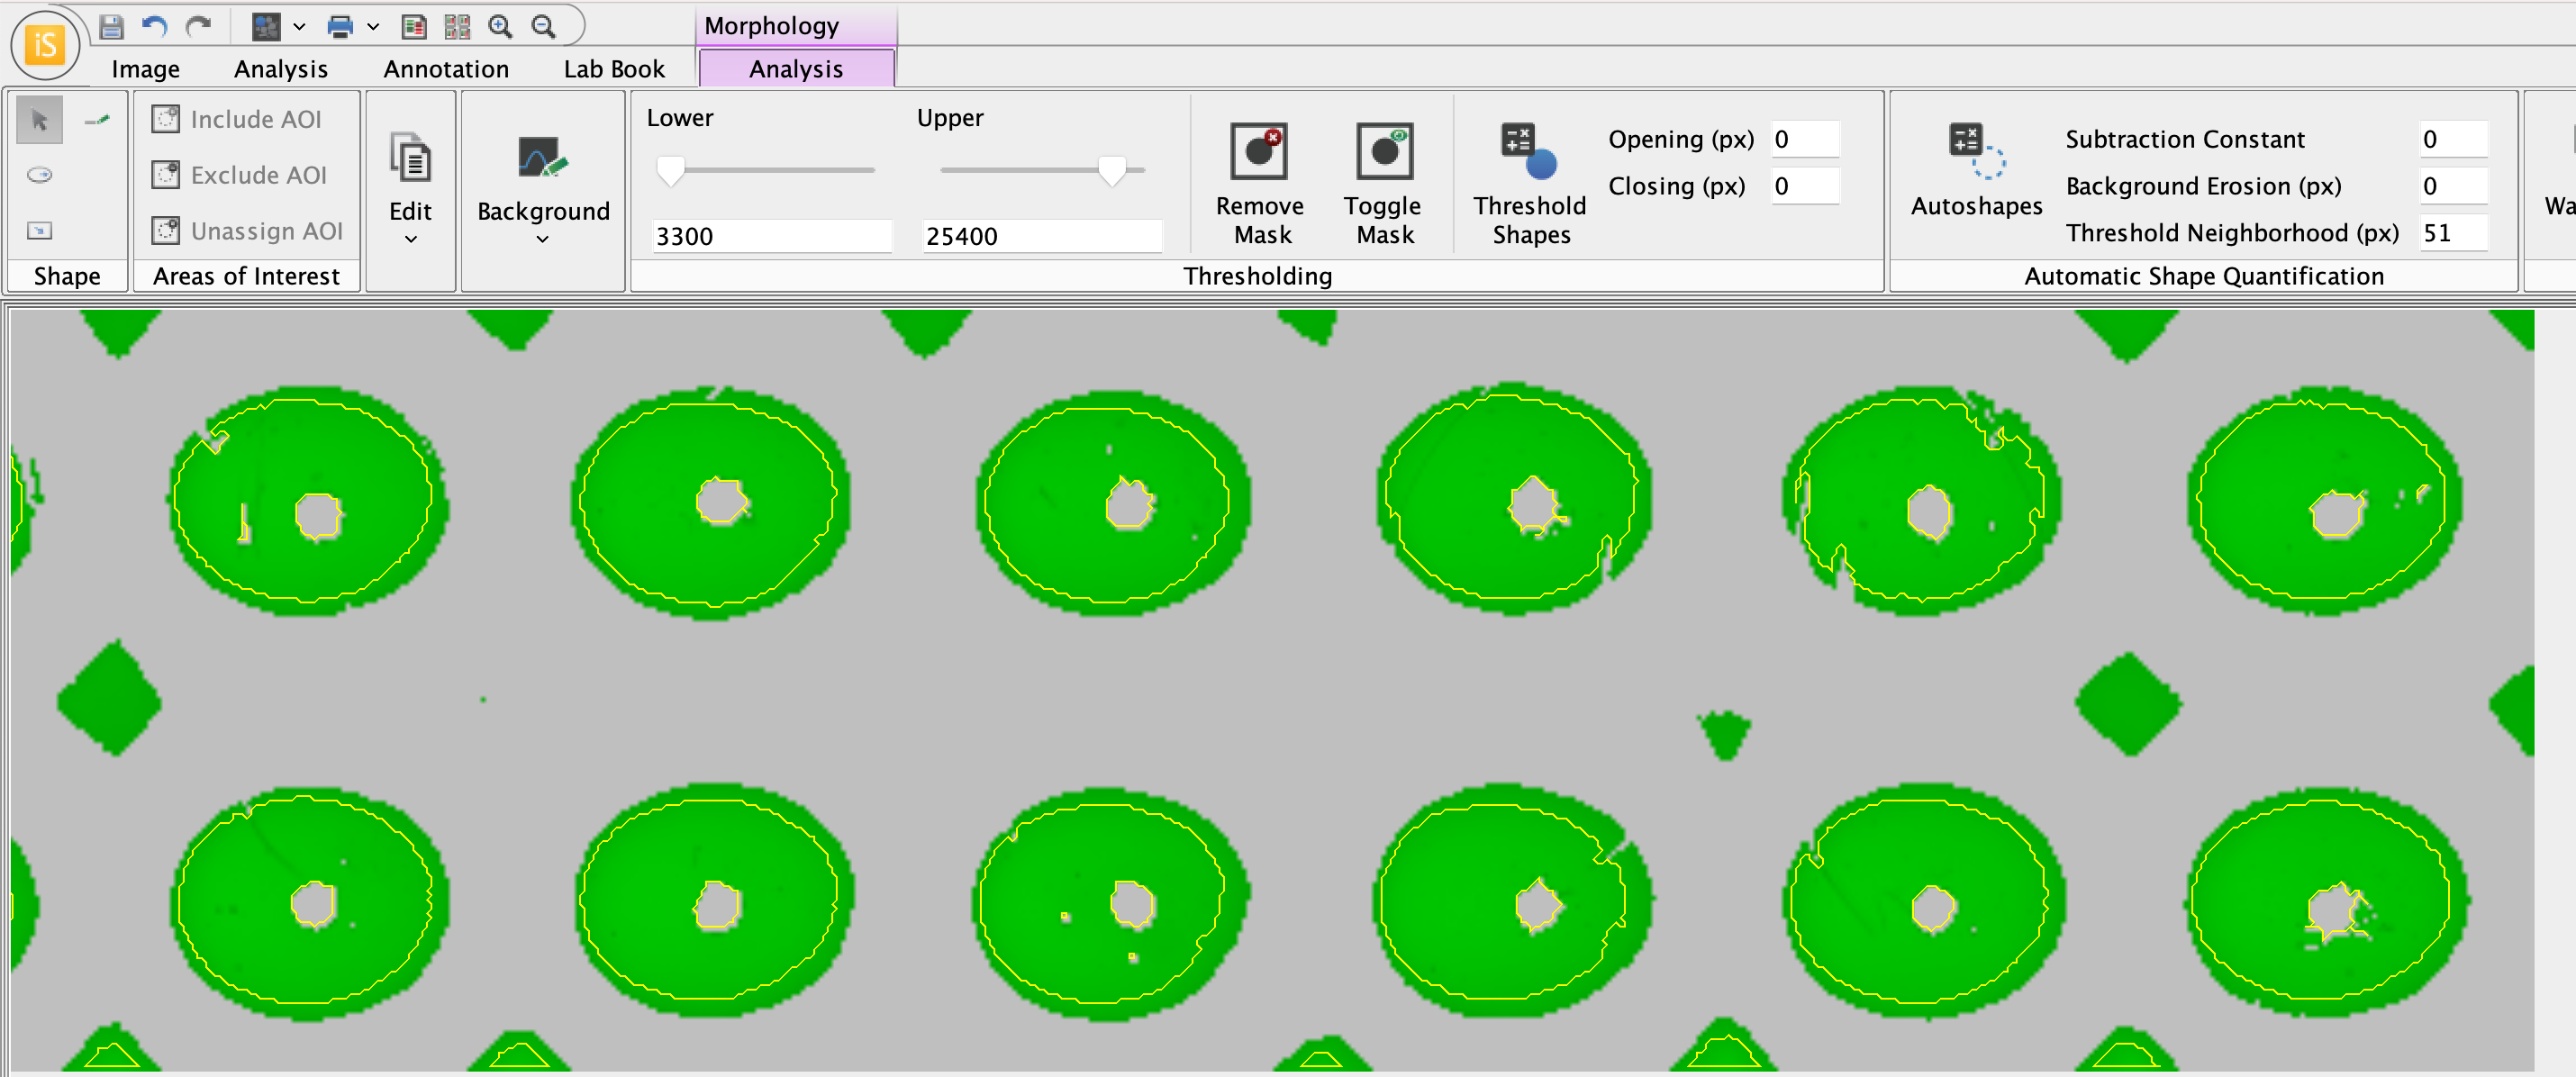
Voila! The spheroids have been found. The image with shapes generated around spheroids will look something like this.
-
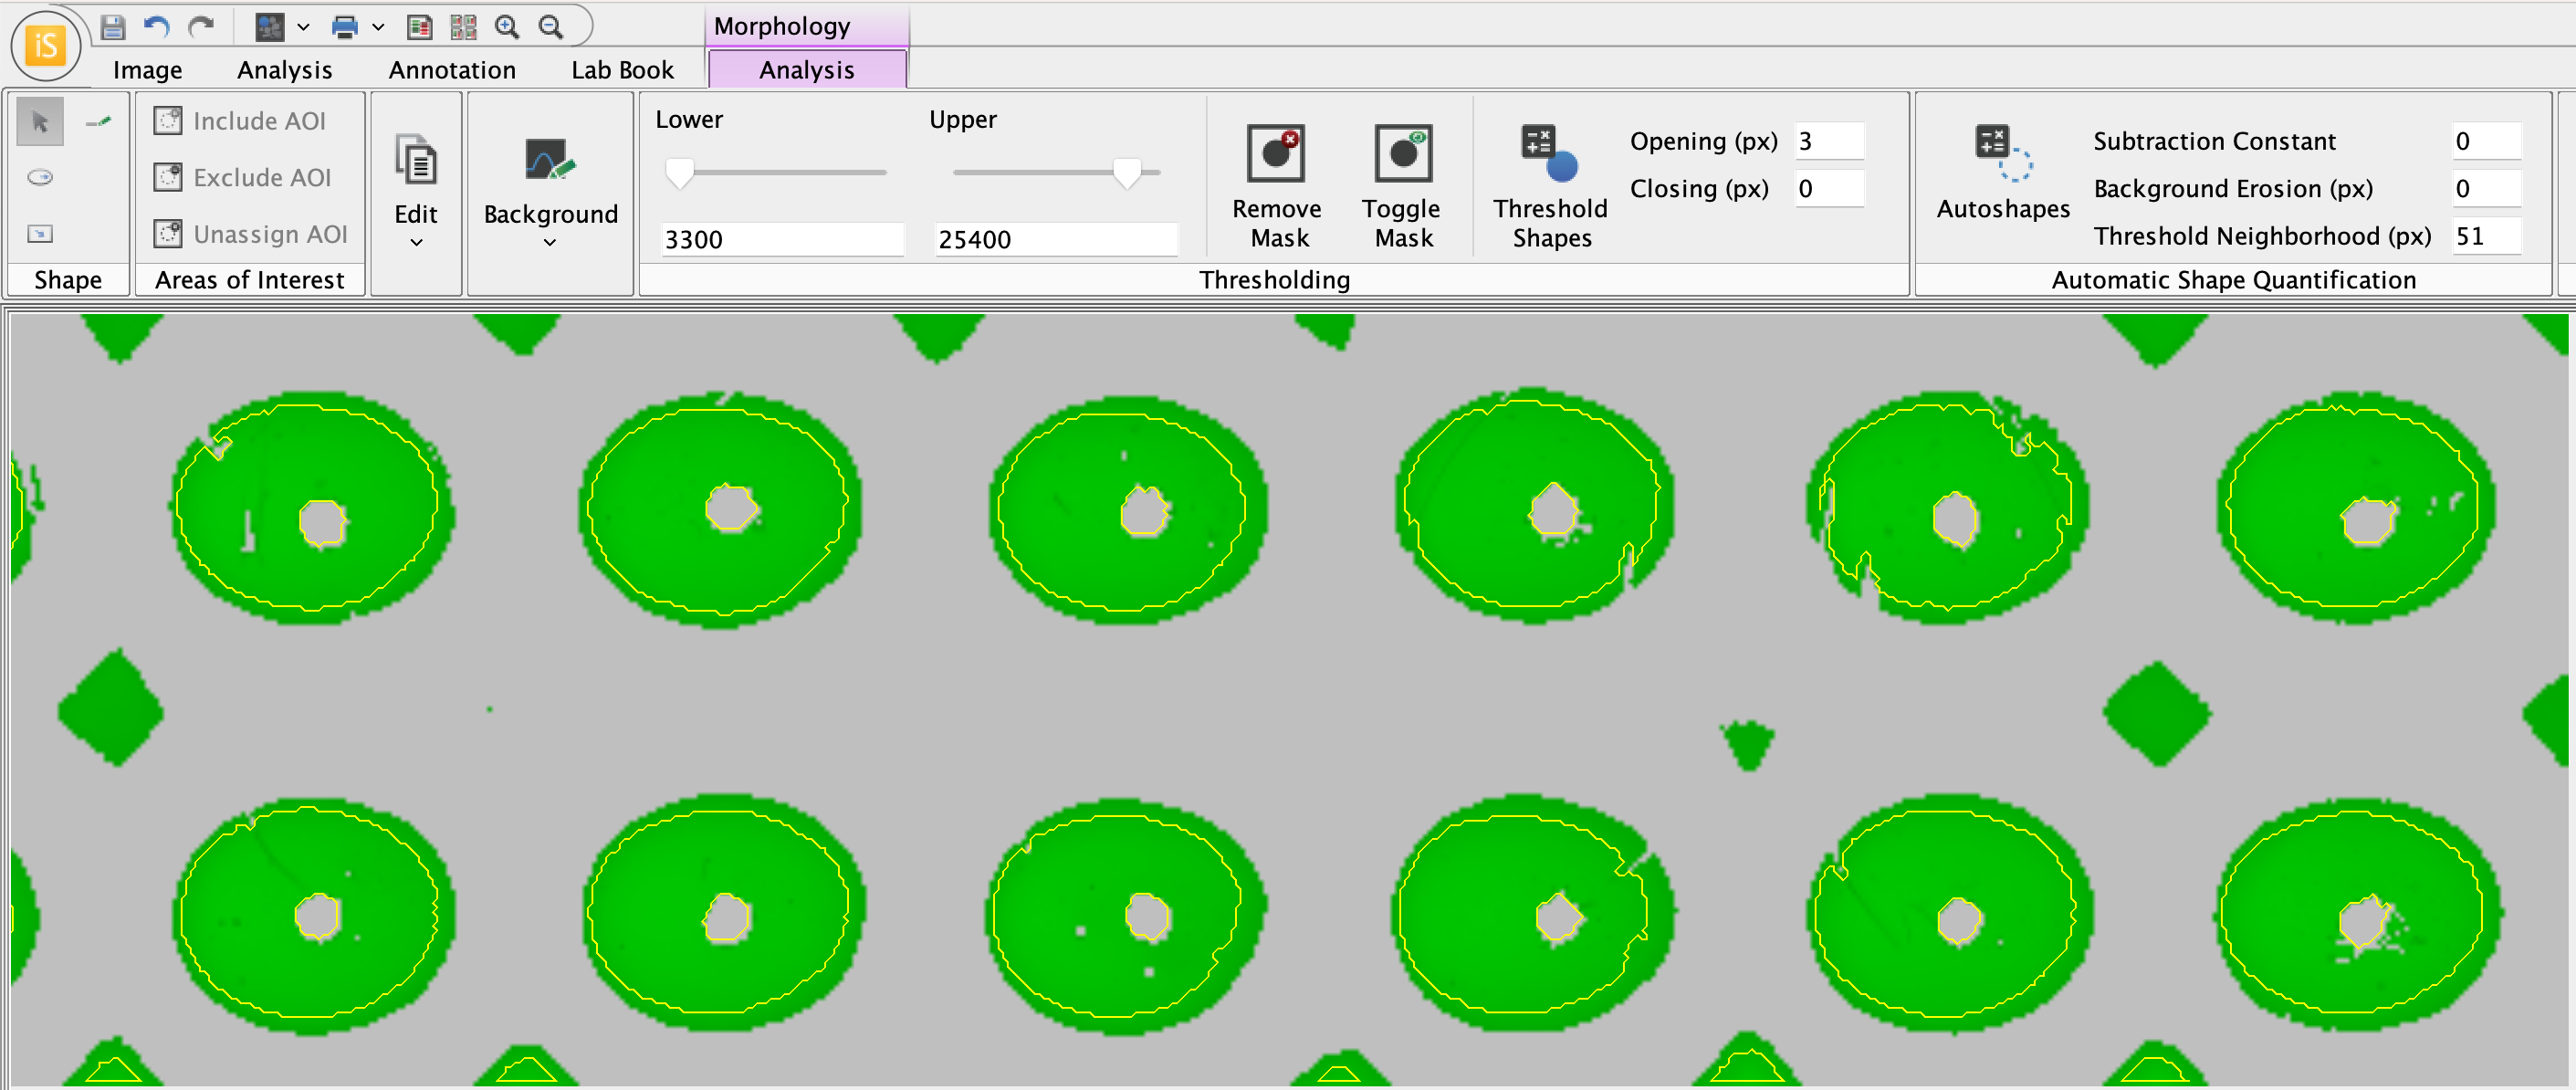
Use Opening and Closing parameters to refine generated shapes as needed.
In the above example image, some generated shapes are not actually around spheroids that need to be analyzed and the shapes for some accurately-identified spheroids include extraneous tendrils that should not need be included in the spheroid area measurements. The Opening parameter can be used to exclude these tendrils from spheroid measurements. In Image Studio, Opening and Closing procedures are performed on the mask to adjust what shapes are generated for analysis. Changing the Opening and Closing parameters does not change the original image.
Here, an Opening parameter of 3 px removes extraneous shapes and tendrils.
-
View the Area measurements in the Morphology Shapes table (toward the bottom of the Image Studio window).
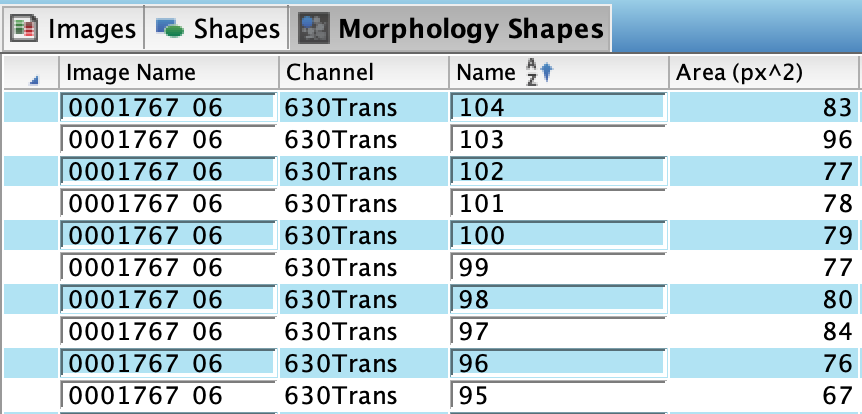
→ This completes the Example 2 analysis.←
Next steps
-
The researcher will need to determine if this analysis and parameters can be used for analysis of all replicate plates.
-
If desired, you can view only shapes generated around spheroids in the Morphology Shapes table (and not display AOIs). If desired, the steps below can be used to delete AOIs from images if they are no longer needed.
-
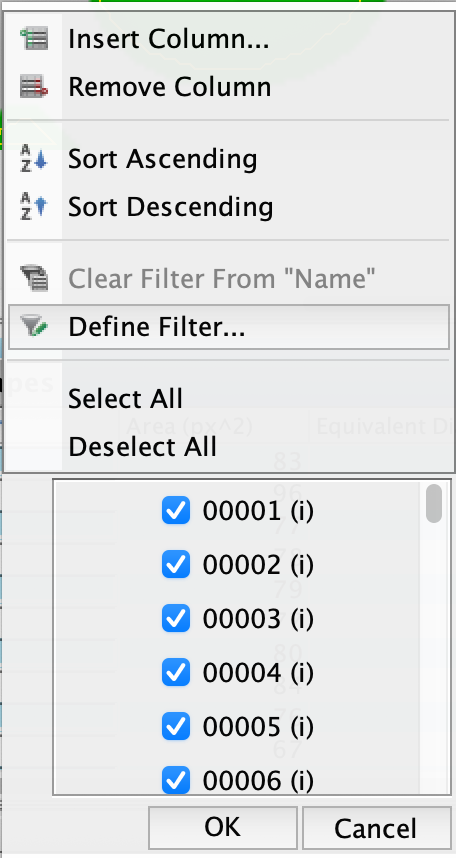
In the Morphology Shapes table, right click the Name column.
-
In the Filter menu, click Define Filter...
-
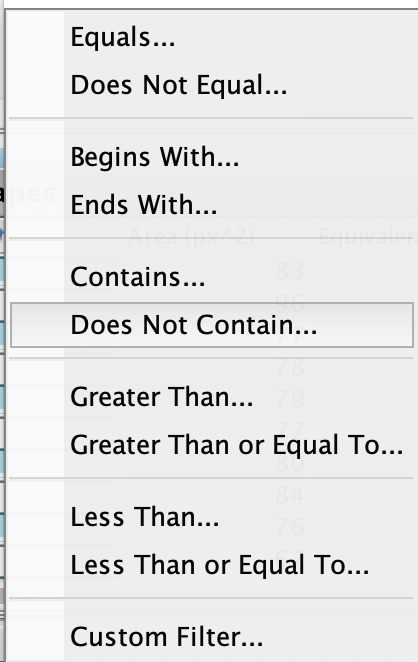
Click Does Not Contain...
-
In the Column Filter Name dialog, enter
(i)in the "does not contain" field. Click OK to filter AOIs out of the Morphology Shapes table.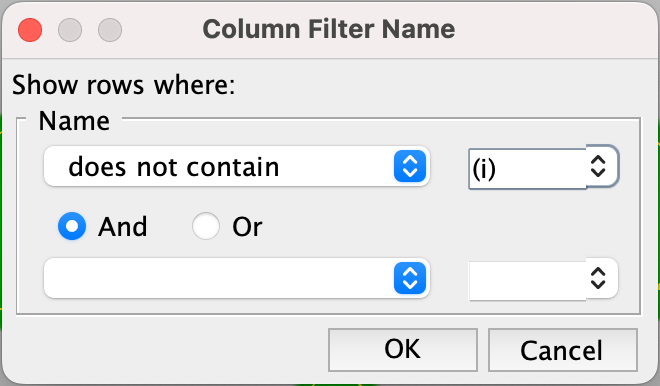
Using Morphology Shapes sort and filter options, you can also delete AOIs if they are not needed as part of your analysis and reporting. With AOIs identified by sorting/filtering, select the AOI rows in the Morphology Shapes table, right click, and then click Delete Rows. This will delete the AOIs.
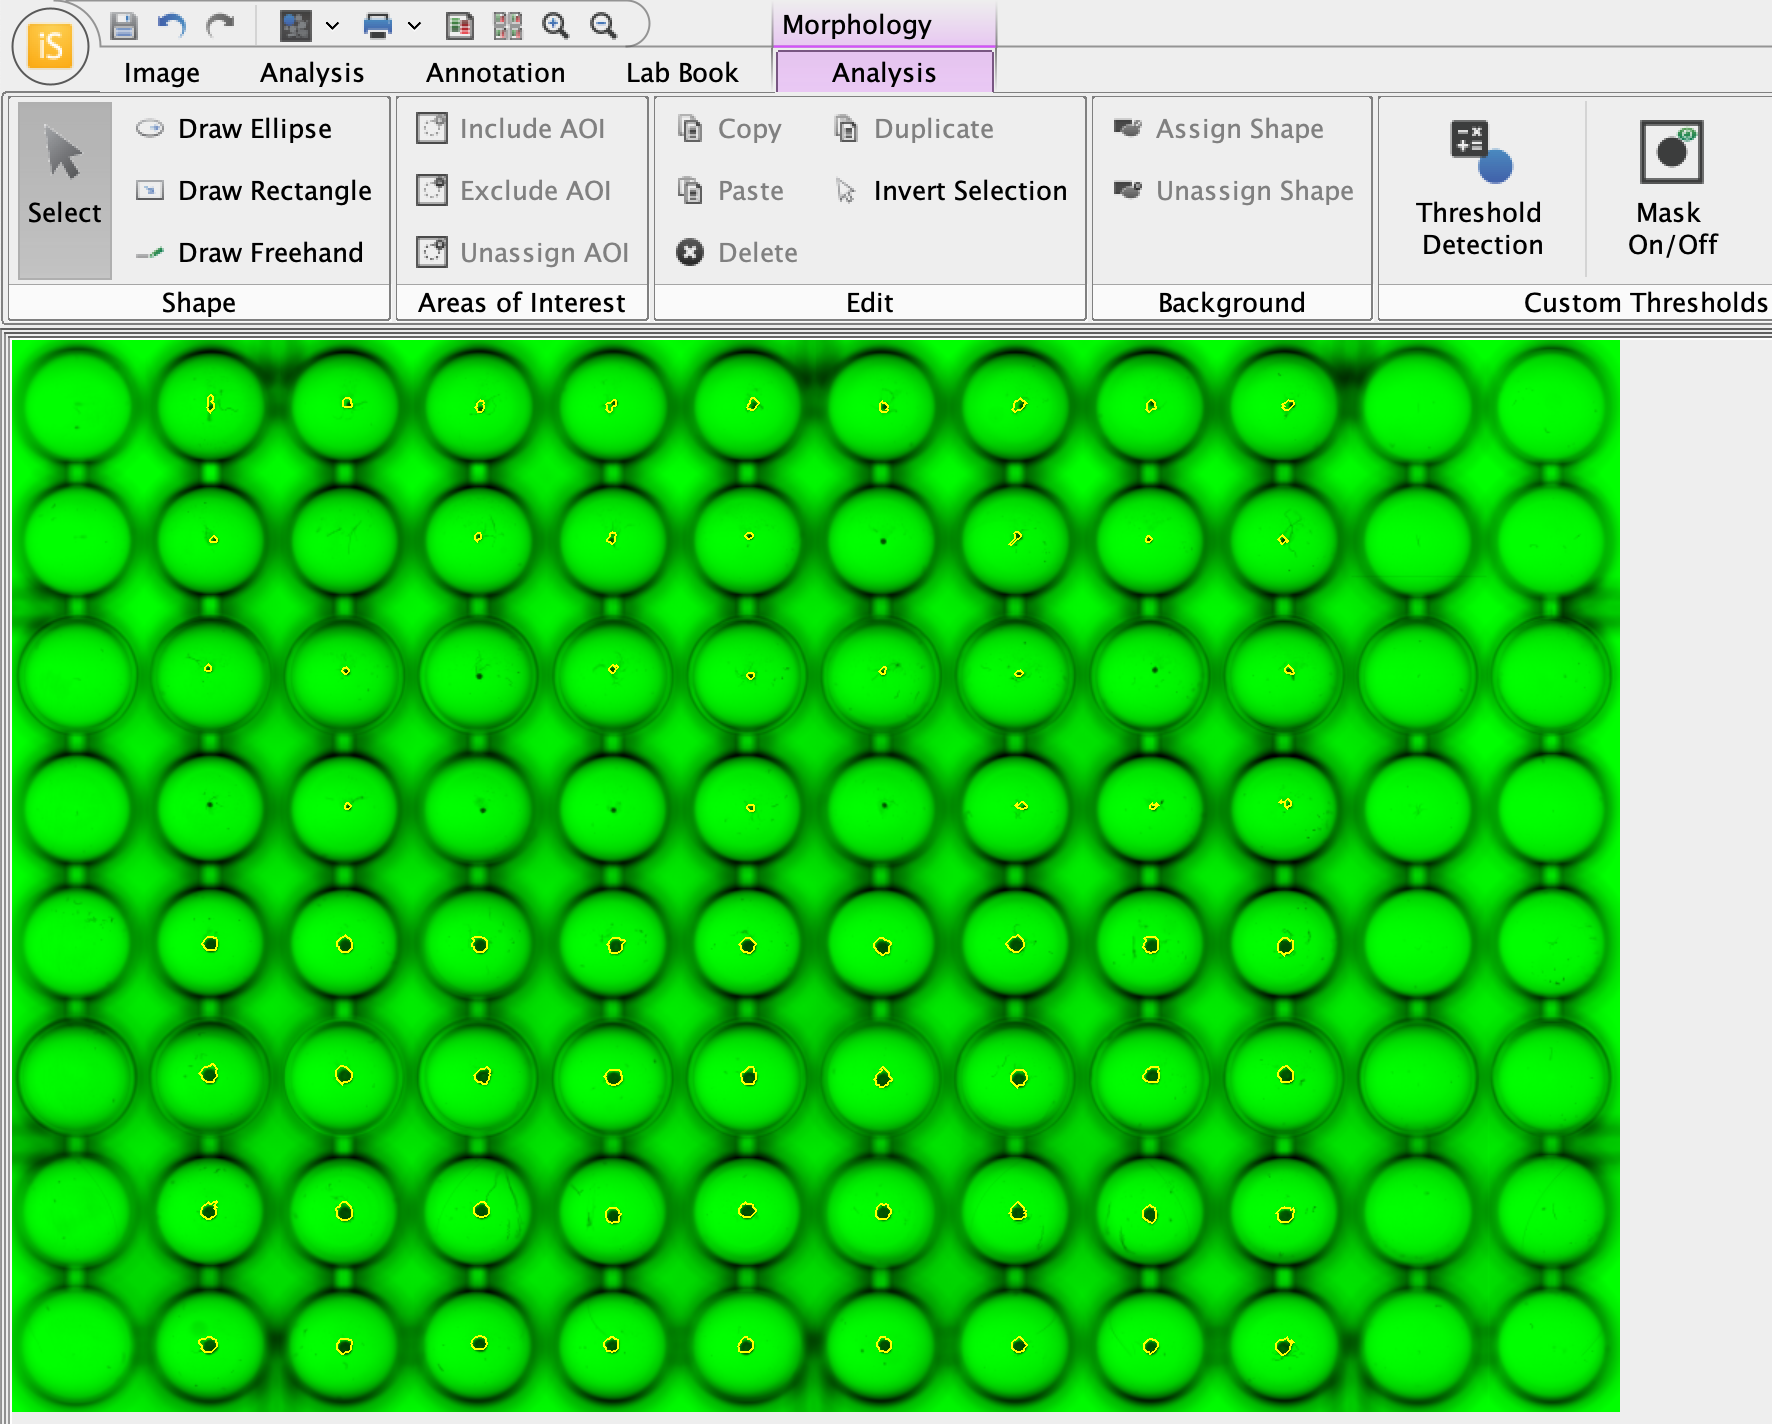
The image analyzed above, without AOIs and with the mask display toggled off, looks like this.
-