Morphology Analysis
Morphology analysis in Image Studio refers to a collection of flexible tools for identifying shapes in an image, counting shapes, and making morphological measurements of the shapes.
Shapes analyzed in morphological assays include spheroids, organoids, bacterial colonies, and others. Morphological measurements include perimeter, area, equivalent diameter, major axis, minor axis, centroid, etc., but total and signal can also be computed.
Plate format Morphology Analysis is available for full plate images. Use Well AOIs to create one Area of Interest for each well in the selected plate format and associate morphology measurements from wells with the well position. The well position, also called the well name or well ID, is stored in the Name column of the Morphology Shapes table, for example A1 through H12 for a 96-well plate.
Templates and batch analysis are available for Morphology Analysis. For more information, see Analysis Automation.
Do not combine tools from the manual Analysis ribbon and the Morphology Analysis ribbon in the same analysis, except when using the manual Analysis ribbon ruler or scale bar to measure a distance.
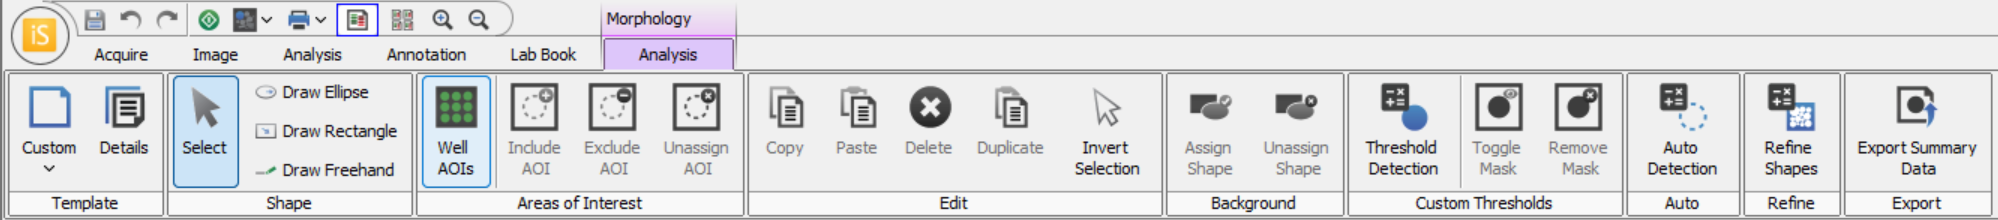
This page provides an overview of tools available in the Morphology Analysis ribbon.
For more information about concepts underlying morphology, see Morphology Analysis Concepts. For more information about available morphology measurements and how they are calculated, see Morphology Analysis Measurements. For some example analyses, see Morphology Analysis Workflow.
Morphology Analysis Tools
Shape Group
Drawing shapes in a Morphology Analysis has many uses.
-
Shapes can be used to measure pixel intensities within the region bounded by the shape. These measurements include Total, Mean, Median, etc. Click Columns to add or remove measurements from the Morphology Shapes table.
-
Shapes can be assigned as Inclusion or Exclusion Areas of Interest (AOI). AOIs can be used to limit where on the image objects will be detected by Morphology Analysis shape detection (see Custom Threshold options or Auto options). AOIs can also be used to group shapes when the column "Inclusion Shapes" is enabled in the Morphology Shapes Table.
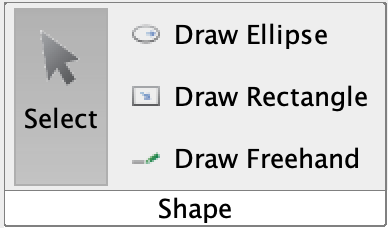
- Select
-
If you are in Draw Ellipse, Rectangle, or Freehand mode, click Select to change your cursor back to a cursor for selecting shapes instead of drawing.
You can also press ESC on your keyboard to change the cursor to Select mode.
- Draw Ellipse
-
Click Draw Ellipse to draw an ellipse on the image. To draw a circle, press and hold the SHIFT key while you click-and-drag the ellipse tool.
- Draw Rectangle
-
Click Draw Rectangle to draw a rectangle on the image. To draw a square, press and hold the SHIFT key while you click-and-drag the rectangle tool.
- Draw Freehand
-
Click Draw Freehand to draw irregularly shaped contours. Click-and-drag the cursor to draw the irregular shape.
Areas of Interest Group
Inclusion and Exclusion AOIs determine where on the image objects will be detected by Morphology Analysis shape detection (see Custom Threshold options or Auto options).
AOIs and Morphology Templates
Image Studio 6.2 introduces analysis template capabilities for Morphology Analysis so that you can use Analysis Automation. To support Morphology templates, Image Studio stores whether AOIs were assigned before or after shape detection.
-
When an AOI is assigned before shape detection, it limits the region of the image considered when shapes are detected.
-
When an AOI is assigned after shape detection, it serves as a grouping tool but does not remove shapes that have already been detected.
- Well AOIs
-
Well AOIs are Inclusion AOIs that are sized and positioned to fit wells on standard ANSI-format plate dimensions. Instead of drawing or detecting each well manually, choose the plate format and Image Studio creates a named AOI for each well using the standard plate footprint for that format. These Well AOIs allow measurements from wells to stay associated with the well position in the plate.
-
Click Well AOIs in the Areas of Interest group.
-
In the Plate Configuration dialog, choose the plate format, such as 6-, 12-, 24-, 48-, 96-, 384-, or 1536-well. Choose the well shape, adjust the well size if needed, and move or resize the plate overlay so the Well AOIs align with the wells in the image.
-
Click Apply.
Image Studio draws Well AOIs on all acquisition channels and assigns them as Inclusion AOIs by default. Shape detection will detect objects inside the Well AOIs.
Applying a plate configuration clears shapes that were already defined on the acquisition. If you need Well AOIs for the analysis, apply the plate configuration before detecting or drawing the other morphology shapes that you want to keep.
-
To associate detected object rows with named Well AOIs, ensure that the Inclusion Shapes column is included in the Morphology Shapes table. The Inclusion Shapes column shows which Inclusion AOI contains the detected object.
The Name column in the Morphology Shapes table stores the well position (may also be called well name or well ID) for each Well AOI, such as A1, A2, and B1.
You can save customized plate configurations and apply them to other Morphology acquisitions in the Work Area. Saved plate configurations preserve the plate format, well shape, well size, and overlay position. When a saved plate configuration is applied to an acquisition with a different resolution, Image Studio scales the configuration to the current acquisition.
If you are creating a Morphology template from an Image Studio 6.1 Work Area opened in Image Studio 6.2, see Morphology Templates from Image Studio 6.1 Work Areas.
-
- Include AOI
-
Select a shape and click Include AOI to assign the shape as an AOI. You can assign more than one shape as an AOI. With AOI(s) assigned, the Detect Shapes tool (in Custom Threshold and Auto) will only detect objects inside the AOI(s).
- Exclude AOI
-
Select a shape and click Exclude AOI to assign the shape as an Exclusion AOI. You can assign more than one shape as an Exclusion AOI. With Exclusion AOI(s) assigned, the Detect Shapes tool (in Custom Threshold and Auto) will only detect objects outside the Exclusion AOI(s).
- Unassign AOI
-
Select an AOI shape or Exclusion AOI shape and click Unassign AOI to return the shape to normal designation. Unassign AOI might be needed, for example, if the wrong shape became assigned as an AOI.
Edit Group
Tools in the Edit group allow you to modify shapes.
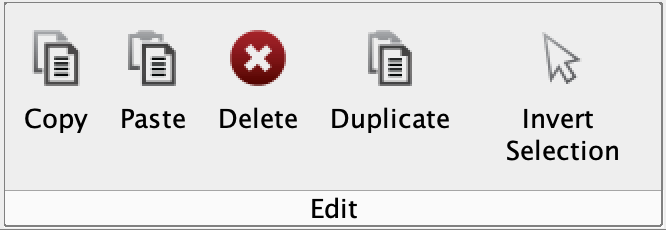
- Copy
-
Select a shape and click Copy to make a copy of the shape that you will place on the image using the Paste tool.
You can also press CTRL + C (⌘ + C) to copy a selected shape.
- Paste
-
After a shape has been copied, click Paste to place the copied shape on the image.
To paste the shape at the location of your cursor, place your cursor where you want the shape and press CTRL + V (⌘ + V) on the keyboard.
- Delete
-
Click Delete (or press Delete on the keyboard) to remove selected shape(s) from the image.
- Duplicate
-
Select a shape and click Duplicate to place a copy of the shape at the same location on every channel of the acquisition.
- Invert Selection
-
Click Invert Selection to change which shapes are selected.
Background Group
Tools in the Background group are used to designate background shape(s) used to calculate a background value that will be used to calculate Signal for the other shapes on the image.
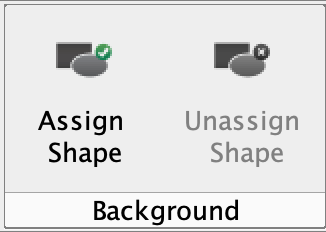
- Assign Shape
-
If you want to calculate Signal (background-adjusted pixel intensity value) for shapes in a Morphology Analysis, you will need to assign a shape or shapes to use as the background. Select the shape to use for background and click Assign Shape.
See Reference for more information about the Signal calculation.

Tip
If the Signal column has
NaNinstead of a number, the most likely problem is that a background shape is not assigned. - Unassign Shape
-
If you have a background shape assigned and you no longer want to use that shape as background, then select the background shape and click Unassign Shape.
Custom Thresholds Group
Tools in the Custom Thresholds group are used to mask and generate shapes around objects that you want to measure.
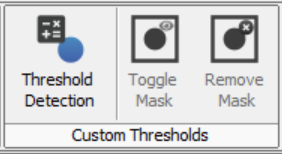
- Threshold Detection
-
Click Threshold Detection to see options for making a mask and detecting objects in the image. You can leave the Custom Threshold dialog open while adjusting parameters to find the parameters needed to detect shapes in your analysis.
If detection is taking a long time and you want to stop detection to try different parameters, click Cancel Detect. Canceled detection changes are discarded, and the image and table return to their previous state.
See Morphology Analysis Workflow for some examples.
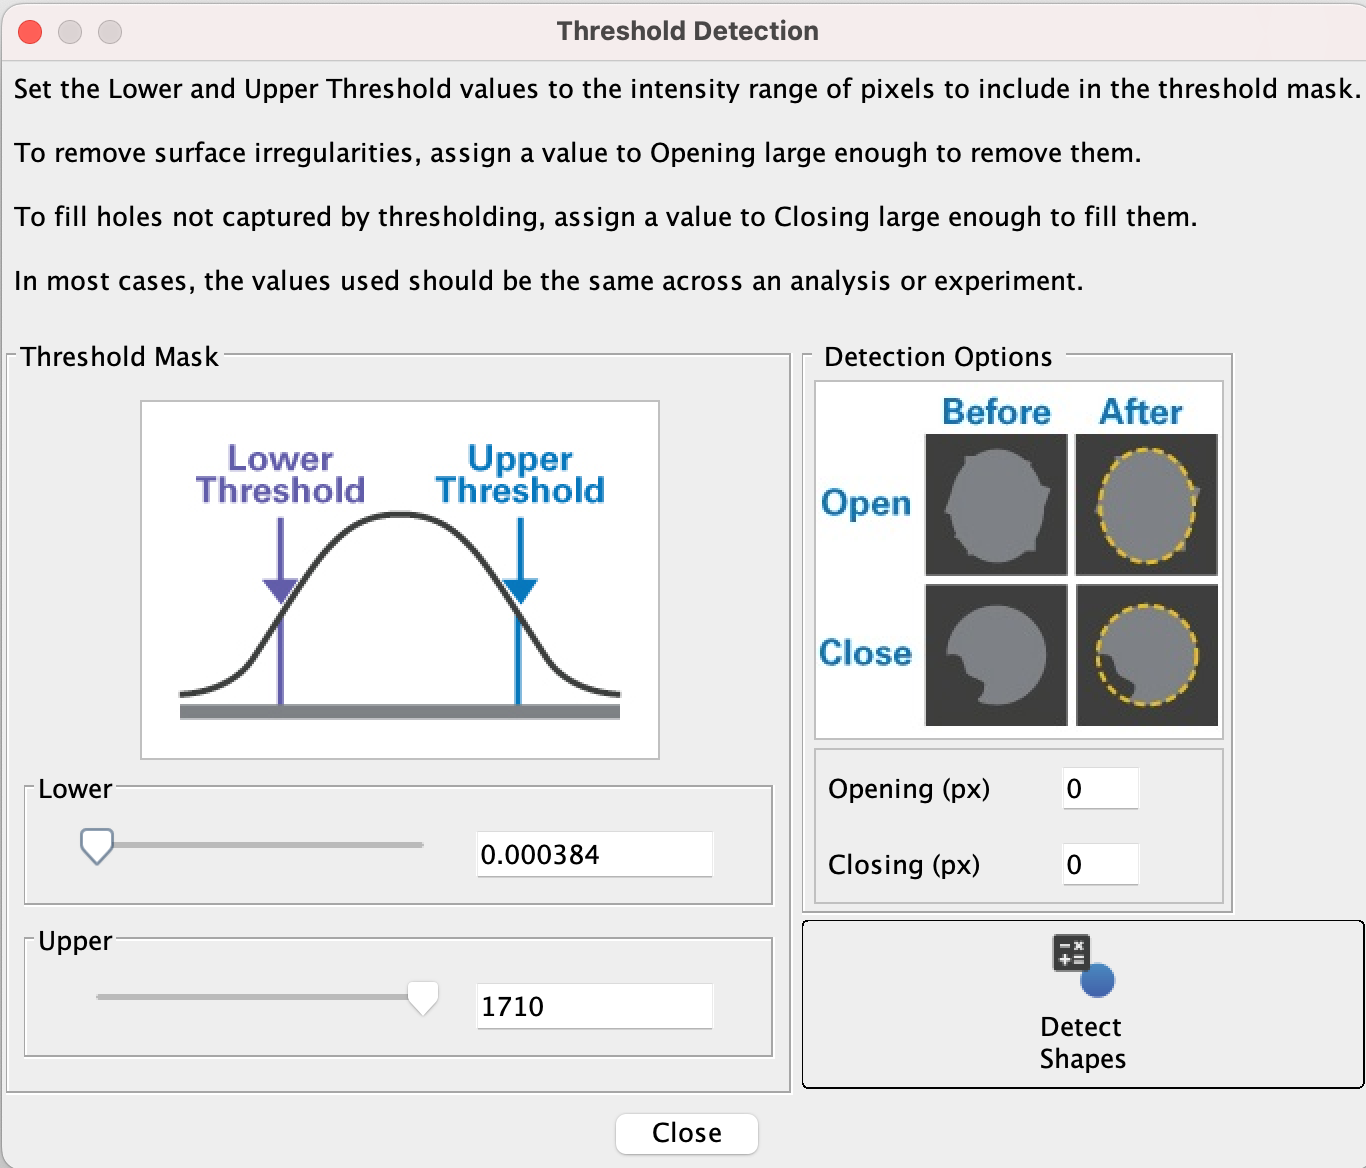
Figure 10. Morphology Analysis Custom Threshold Dialog -
Adjust the Upper and/or Lower thresholds as-needed to include the pixel intensities of the objects in the image that you want to measure. You can adjust the sliders, or you can enter values in the field and press Enter.
When thresholds are set well, the mask (shown as gray pixels) will overlay the objects on the image that you want to measure.
-
When the mask is shown over the objects that you want to measure, click Detect Shapes. Contours will be drawn around the objects and measurements will be available in the Morphology Shapes table at the bottom of the Image Studio window.
-
Use Include Border Shapes to choose whether detected shapes that touch the edge of the acquisition or an Inclusion AOI are included. This can help exclude partial objects from the results.
-
If contours around objects have artifacts that should not be included in your analysis (e.g., jagged edges, insubstantial tendrils coming off the shape, or small joins between shapes), then consider adjusting the Opening parameter to remove these artifacts.
Start with an Opening parameter that is roughly the length of the artifact(s) that need to be removed. You can use the Analysis ribbon > Draw Ruler tool to measure, or you can point your cursor to sides of the artifact and find the length between the coordinates shown in the lower right of the Image Studio window. Adjust as needed.
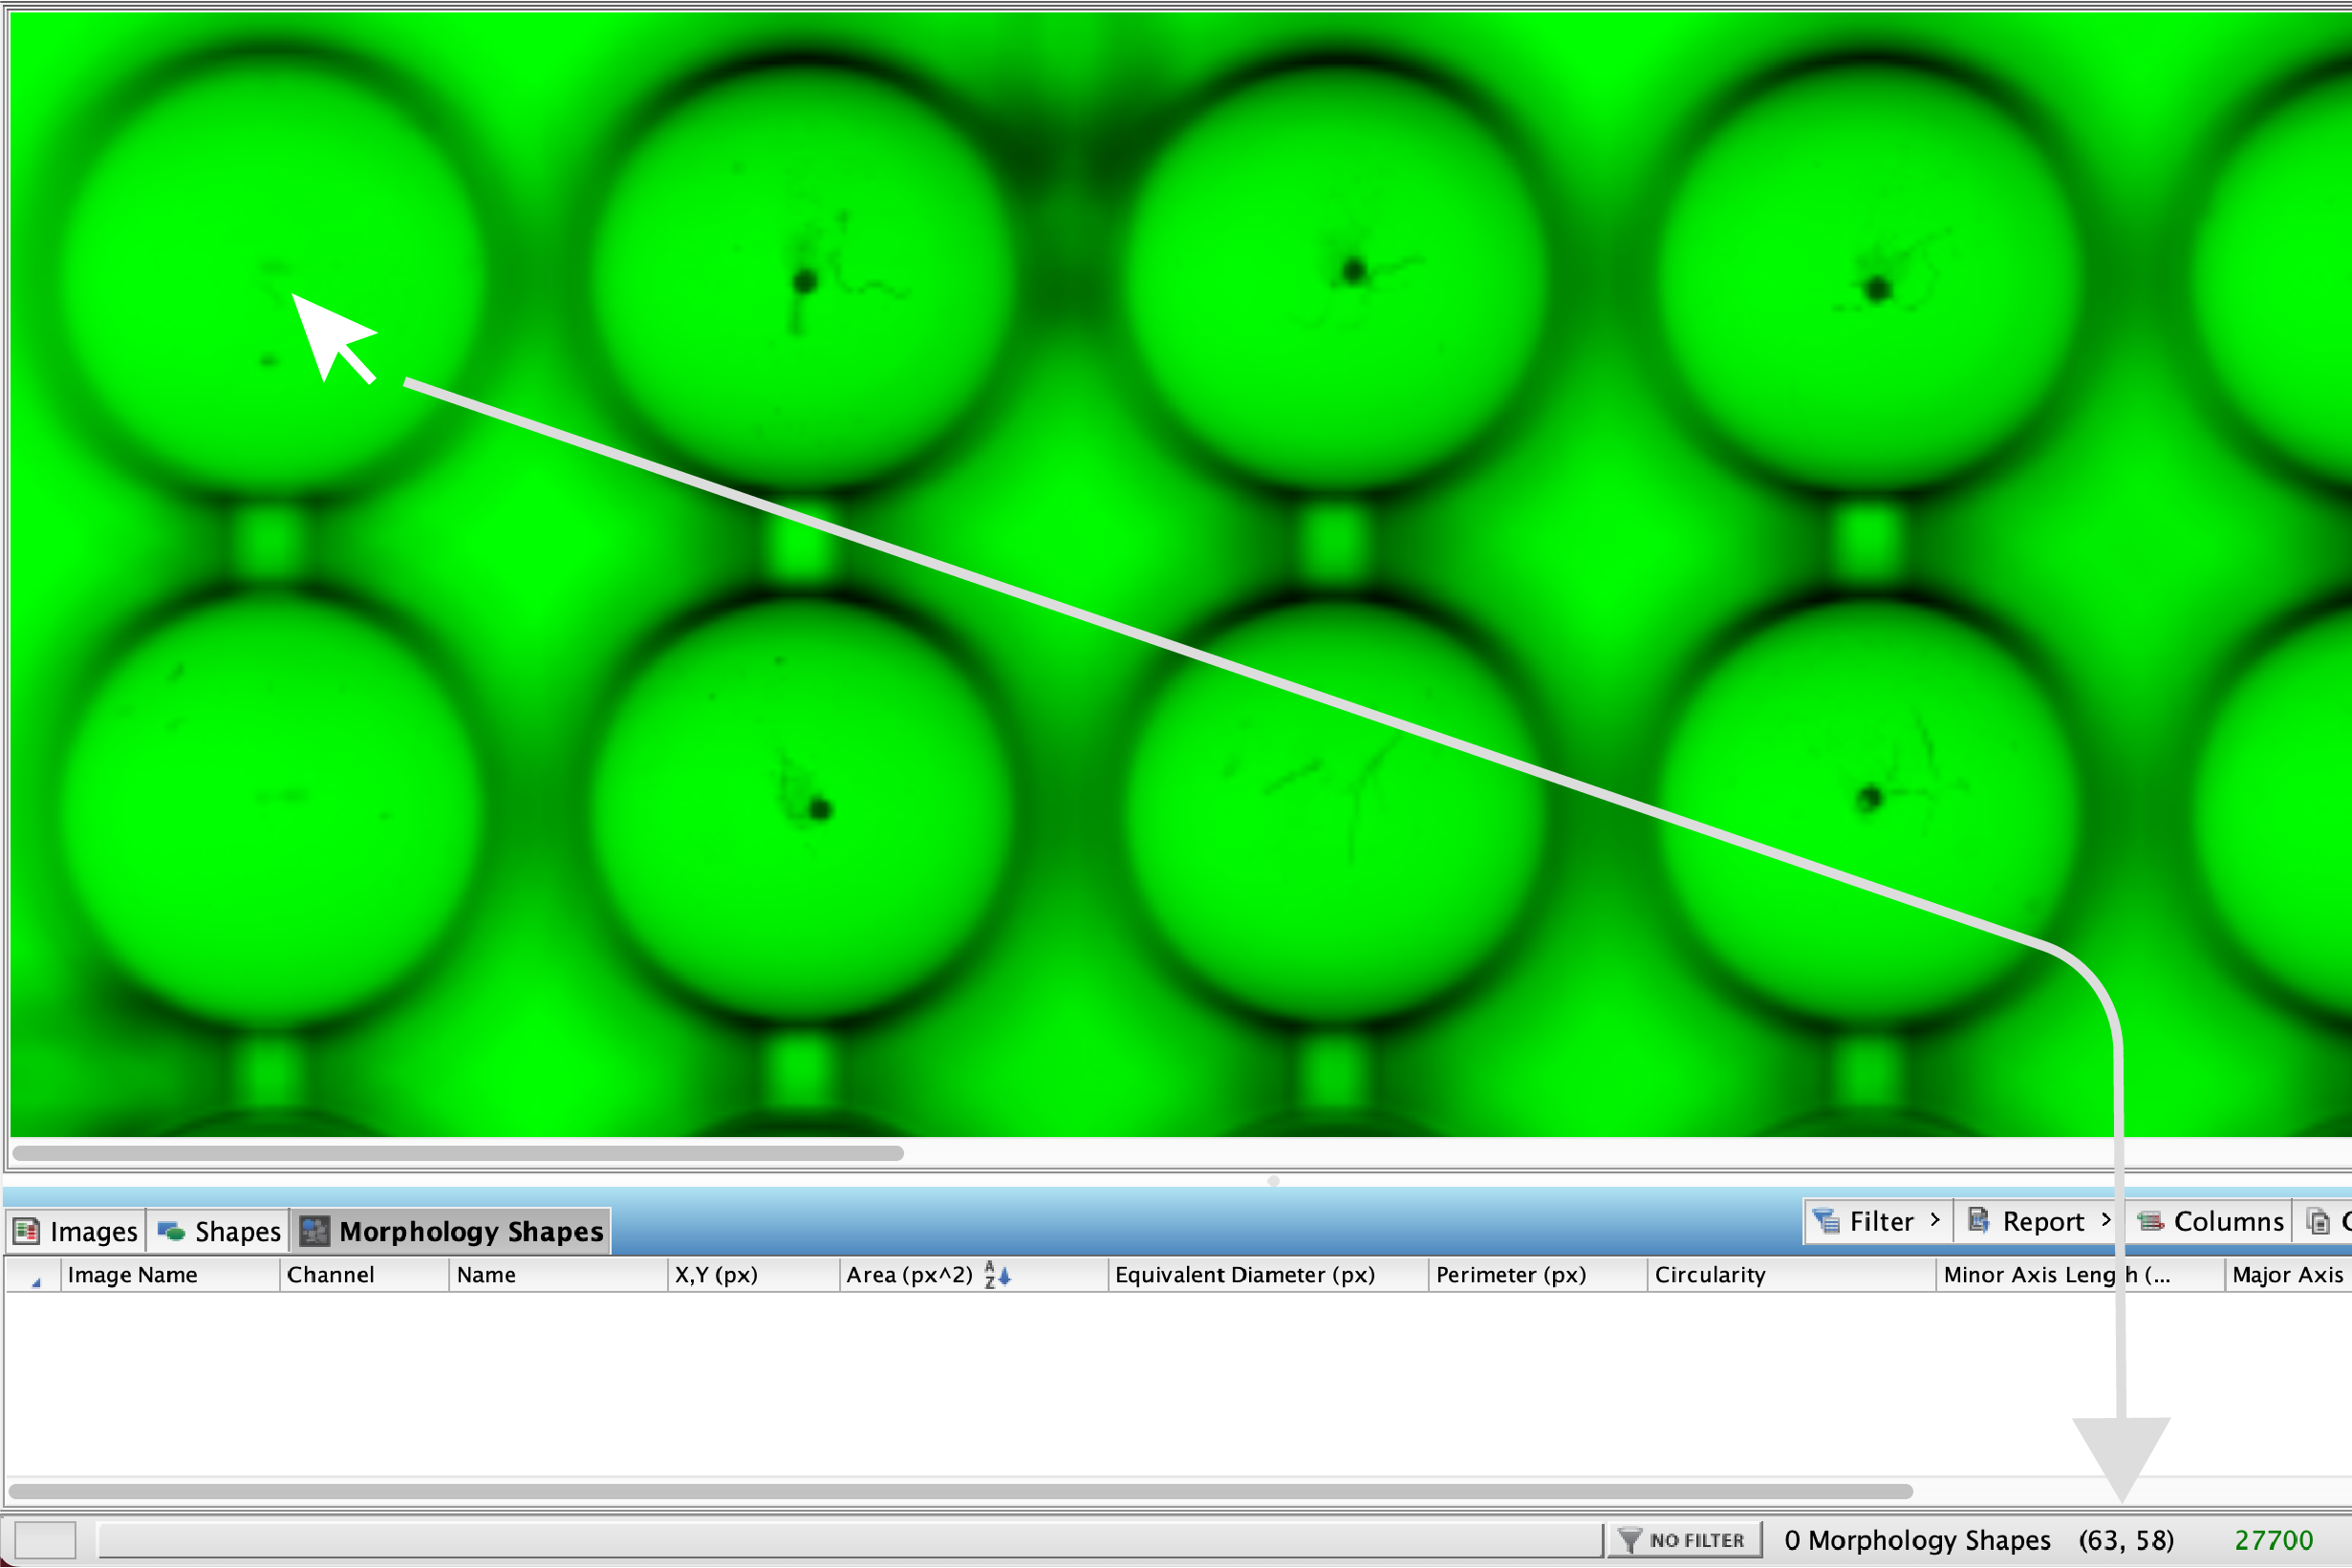
Figure 11. When you hover your cursor over the image, the coordinates of your cursor are shown in the lower right corner of the Image Studio window. Click Detect Shapes after you have adjusted the Opening parameter to re-generate contours around shapes.
-
If contours around objects have holes or gaps that should not be included in your analysis, then consider adjusting the Closing parameter to close these gaps.
Start with a Closing parameter that is roughly the length of the gap to fill. You can use the Analysis ribbon > Draw Ruler tool to measure, or you can point your cursor to sides of the gap and find the length between the coordinates shown in the lower right of the Image Studio window. Adjust as needed.
Click Detect Shapes after you have adjusted the Closing parameter to re-generate contours around shapes.
-
- Mask On/Off
-
Click Mask On/Off to see the image with or without the mask.
- Remove Mask
-
Click Remove Mask to remove the mask from the acquisition. Thresholds will return to their default values when the mask is removed.
Auto Group
Tools in the Auto group are used to mask and generate shapes around objects that you want to measure.
Choose the foreground option that matches how the objects look on the image. If the objects you want to detect are lighter than the background, choose Bright Foreground. If they are darker than the background, choose Dark Foreground.
- Auto Detection
-
Click Auto Detection to see options for making a mask and detecting objects in the image. You can leave the Auto Detection dialog open while adjusting parameters to find the parameters needed to detect shapes in your analysis.
Auto Detection detects shapes using an adaptive thresholding algorithm. Generally, you will choose between removing background using a single constant or a rolling ball image erosion technique.
If detection is taking a long time and you want to stop detection to try different parameters, click Cancel Detect. Canceled detection changes are discarded, and the image and table return to their previous state.
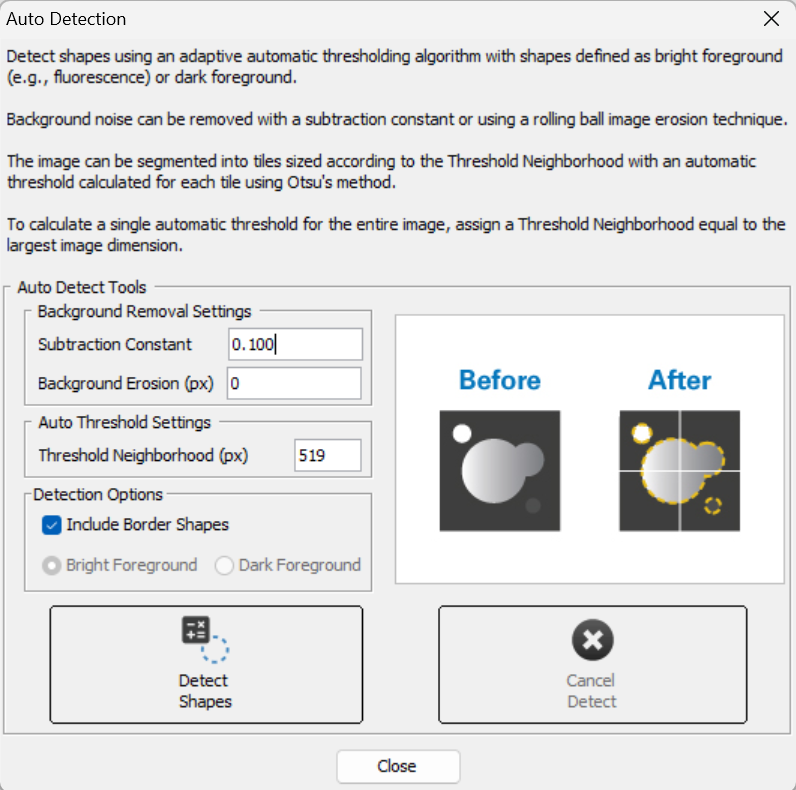
Figure 13. Morphology Analysis Auto Detection Dialog -
For Trans and Epi images, choose Bright Foreground or Dark Foreground.
Choose Bright Foreground when the objects you want to measure look lighter than the background. Choose Dark Foreground when they look darker than the background.
-
Use Include Border Shapes to choose whether detected shapes that touch the edge of the acquisition or an Inclusion AOI are included. This can help exclude partial objects from the results.
-
If there is a uniform and consistent background, enter that background value in the Subtraction Constant. The Subtraction Constant is subtracted from all pixels in the image before the adaptive thresholding algorithm is run. You can assess the background by pointing your cursor around the background of the image and looking at the pixel intensity displayed in the lower right corner of the Image Studio window. You could also draw a shape around the background and look at the Mean, Median, or other measurement for the shape that is appropriate for your analysis.
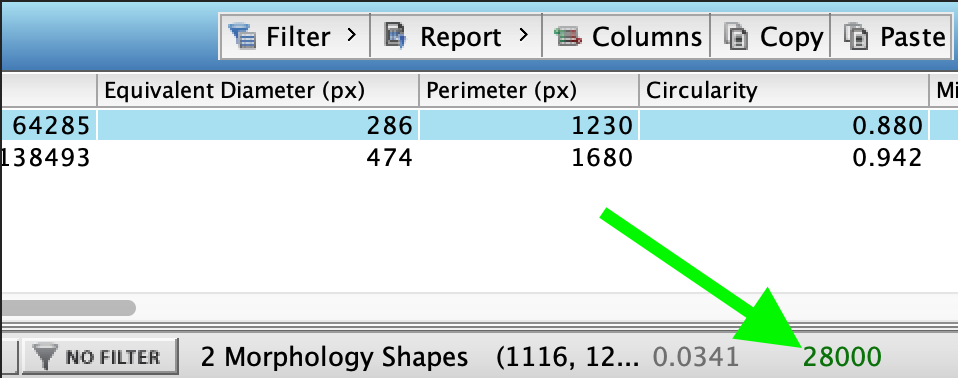
Figure 14. The pixel intensity is shown in the lower right corner of the Image Studio window. The pixel intensity text is shown in the same color as the display color for the image channel. -
If the background varies throughout the image and you need an adaptive method to remove background from the shape detection process, the Background Erosion can be a better option than the Subtraction Constant.
A good starting point for Background Erosion is a value slightly larger than the largest object that you want to detect. You can use Analysis ribbon > Draw Ruler to estimate the size of objects on the image.
-
For densely populated images, set the Threshold Neighborhood to the width of the largest object to identify. Increase the Threshold Neighborhood if too many objects are found.
For sparsely populated images, set the Threshold Neighborhood to half the width of the image. Decrease the Threshold Neighborhood if too many objects are found.
-
Refine Group
Further refine detected shapes using watershed segmentation.
- Refine Shapes
-
Click Refine Shapes to see options for identifying foreground and background for watershed segmentation.
If refinement is taking a long time and you want to stop refinement to try different parameters, click Cancel Refine. Canceled refinement changes are discarded, and the image and table return to their previous state.
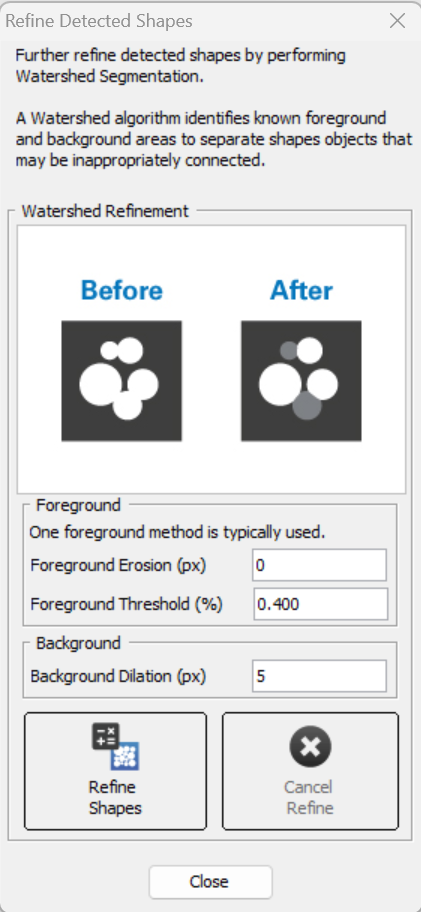
Figure 16. Morphology Analysis Refine Detected Shapes Dialog -
If all the objects that you want to measure are roughly the same size, then using a pixel value for Foreground Erosion may be sufficient. For Foreground Erosion, it is generally best to start with a value that is small compared to the objects you need to measure and then increase as needed.
If all the objects that you want to measure are roughly the same size, then using Foreground Threshold percentage may work better.
-
Set a Background Dilation value for identifying background. It is generally best to start with a value that is small compared to the objects you need to measure and then increase as needed.
-
Click Refine Shapes to perform the watershed segmentation. You can leave the Refine Detected Shapes dialog open while you adjust parameters and repeat watershed segmentation as-needed.
-
Export Group
Use options in the Export group to summarize and export data from the Morphology Shapes table.
- Export Summary Data
-
Click Export Summary Data to export a spreadsheet with the option of having data in length units (µm, mm, and cm) instead of pixels.
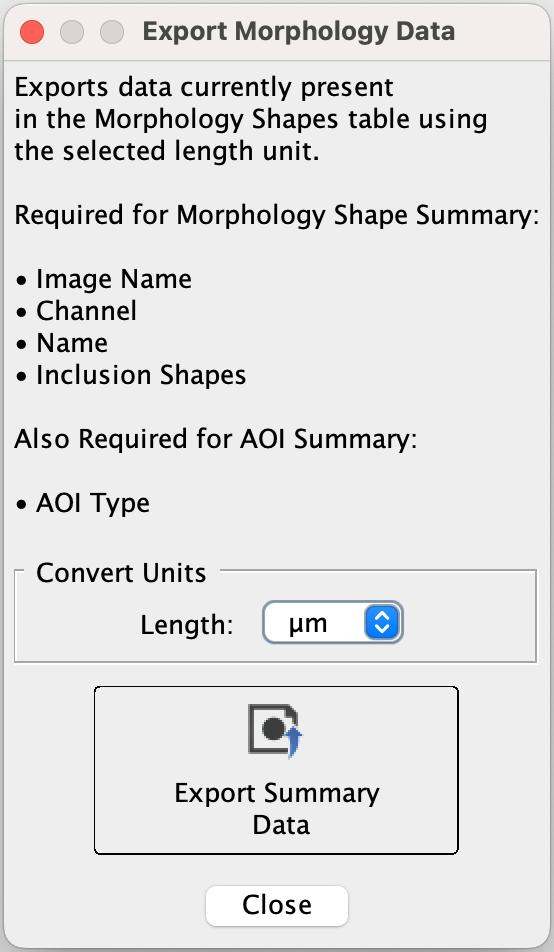
Figure 18. Morphology Analysis Export Morphology Data Dialog Ensure all the necessary columns (listed in the dialog) are in the Morphology Shapes table. If any are missing, click Columns (near the lower right corner of the Image Studio window) and choose the columns to add.
Both the Image Name and Resolution columns are required to uniquely identify shapes and convert Morphology values correctly. If either column is missing from the Morphology Shapes table, Image Studio displays the following warning when export is attempted:
"Ensure both the Image Name and Resolution columns are in the Morphology Shapes table. Add the missing column(s), then retry exporting.
Choose Length units and then click Export Summary Data. When you are done exporting data, click Close."
Morphology Analysis Concepts
This topic provides an overview of concepts important to Morphology Analysis in Image Studio.
Concepts
- Morphological Analysis
-
Morphological analysis refers to image processing and analysis techniques used to measure geometric properties of shapes in an image.
Measuring the area of a spheroid in an image is an example of morphological analysis.
- Mask
-
Filter used to designate regions used by morphology processes to identify shapes.
The mask in Image Studio morphological analysis can be created from manually set pixel intensity thresholds (upper and lower) or from automatically determined pixel intensity thresholds (upper and lower). The mask created by the manually set pixel intensity thresholds is visible as gray pixels that overlay regions of interest (i.e., regions that fall within the upper and lower thresholds) on the image being analyzed. The mask generated by Auto Detection is not displayed over the image.
- Dilation
-
In general, dilation is a processing step used to increase the size and solidity of shapes in an image analysis.
Dilation works by comparing the intensity value for each pixel location in an image with other pixels in its "neighborhood" and setting the intensity of that pixel location in the output image to the maximum pixel value in the neighborhood. The neighborhood is defined by a matrix known as a structuring element.
When used in Image Studio Morphology Analysis, dilation is performed on the image mask as part of Threshold Shapes process or Refine Shapes process. When parameters are set such that dilation will be performed as part of Threshold Shapes or Refine Shapes, the shapes identified can be changed due to the dilation process, but the original image is not modified.
Dilation is the opposite of erosion.
- Erosion
-
In general, erosion is a processing step used to remove insubstantial shapes, smooth jagged edges, remove small joins between shapes, and to leave only shapes that are meaningful to the image analysis.
Erosion works by comparing the intensity value for each pixel location in an image with other pixels in its "neighborhood" and setting the intensity of that pixel location in the output image to the minimum pixel value in the neighborhood. The neighborhood is defined by a matrix known as a structuring element.
When used in Image Studio Morphology Analysis, erosion is performed on the image mask as part of Threshold Shapes process or Refine Shapes process. When parameters are set such that dilation will be performed as part of Threshold Shapes or Refine Shapes, the shapes identified can be changed due to the erosion process, but the original image is not modified.
Erosion is the opposite of dilation.
- Structuring Element
-
The structuring element is a matrix used to define the pixel neighborhood used for erosion and dilation.
During erosion and dilation, the structuring element is scanned pixel by pixel over the entire image. During the scan, each pixel will be evaluated against the pixels in its neighborhood. The neighborhood is defined by the dimensions of the structuring element.

Figure 19. Illustration showing how a structuring element is used in the dilation process. In the erosion process, the smallest pixel from the neighborhood (defined by the structuring element) is used instead of the largest pixel intensity. - Opening
-
In general, opening means to perform erosion and then dilation. The intent of opening is to make the erosion and dilation refinements, while generally preserving object size.
When used in Image Studio Morphology Analysis, opening is performed on the image mask. The original image is not modified.
- Closing
-
In general, closing means to perform dilation and then erosion. The intent of opening is to make the dilation and erosion refinements, while generally preserving object size.
When used in Image Studio Morphology Analysis, closing is performed on the image mask. The original image is not modified.
Morphology Analysis Measurements
This topic defines measurements that are available in Image Studio Morphology Analysis.
First, it is important to understand contours.
-
The term contour refers to the boundary around objects in the image. The contour separates the object being measured from the image background. Objects can be spheroids, organoids, bacterial colonies, etc.
-
Image Studio identifies objects and draws contours based on pixel intensity thresholds set by the researcher (in Custom Thresholds) or by using an adaptive thresholding algorithm (in Auto Detection).
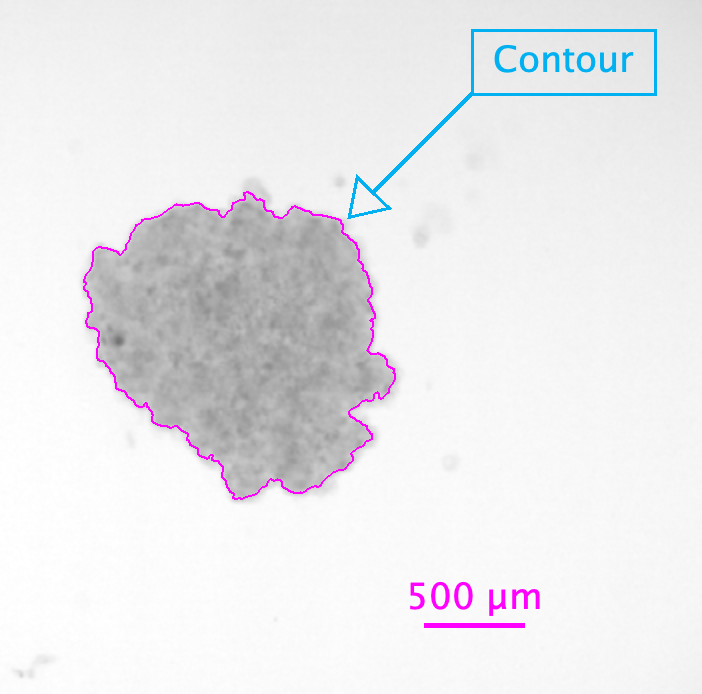
Figure 20. This screenshot shows an automatically generated contour that Image Studio has drawn around a spheroid.
Measurements
To change which measurements are displayed in the Morphology Shapes table, click Columns ![]() and select the measurements that you want to see.
and select the measurements that you want to see.
Data can be converted from pixels to physical units and exported using the Export Summary Data button on the Morphology Analysis ribbon. Supported physical units are mm, um, and cm. Conversions are based on the instrument's precise, resolution-dependent pixel size.
You can filter the Morphology Shapes table to include meaningful data and exclude outliers. Right click the table header of the column that you need to filter, or click Filter directly above the table to see filter options. The contour for shapes filtered out of the table will not be displayed on the image.
- Area
-
Number of pixels enclosed within the contour of a shape.
In some cases, some detected shapes may show an Area of
0in the Morphology Shapes table. This is a numerical artifact of the arrangement of pixels that are present and how those pixels are used in methods that calculate other values.These rows can be useful to show in the table as a measure of how suitable morphology analysis parameters are for detecting shapes in the image. If many zero-area shapes are present, that may indicate an inherently noisy collection, such as dust on the slide, and a very long major axis may indicate a hair on a plate.
- Perimeter
-
The length of the contour around the shape.
- Equivalent Diameter
-
The diameter of the circle whose area is same as the contour area.

- Minor Axis Length
-
The length of the shortest diameter of an ellipse fitted to the contour of the shape.
- Major Axis Length
-
The length of the longest diameter of an ellipse fitted to the contour of the shape.
- Threshold Upper
-
Upper limit of pixel intensities used to define the image mask when Custom Threshold is used to draw detect objects.
Pixels above this limit are excluded from the mask and are not detected using Custom Threshold.
- Threshold Lower
-
Lower limit of pixel intensities used to define the image mask when Custom Threshold is used to draw detect objects.
Pixels below this limit are excluded from the mask and are not detected using Custom Threshold.
- Centroid
-
The geometric centroid of the shape.
- Compactness
-
The compactness of the shape (the ratio of the perimeter squared to
4 × π × Area).
- Circularity
-
How closely a shape resembles a circle (from 0 to 1, where 1 is perfectly circular).

- Eccentricity
-
Measure of how much a shape deviates from being circular.

- Feret Diameter (Mean, Maximum, and Minimum)
-
Distance between two parallel tangents on opposite sides of a shape. The Feret Mean, Feret Maximum, and Feret Minimum are calculated from many orientations of the shape. Sometimes the analogy "caliper diameter" is used to explain the Feret Diameter.
- Solidity
-
The solidity of the shape (the ratio of the area to its convex hull area).

Morphology Shapes Table
The Morphology Shapes table is where the morphology analysis measurements described in this topic are shown for each shape. Measurements in the table are shown in pixels. To export data in physical units instead of pixels, click Export Summary Data on the Morphology Analysis ribbon and choose Length units. Supported physical units are mm, um, and cm.
The Shapes column indicates which type of shape each shape in the morphology analysis is. This column is not displayed in the Morphology Shapes table by default. To add it, click Columns ![]() and select Shapes.
and select Shapes.
| Shapes Column Value | Shape Type |
|---|---|
| Rectangle | User-drawn rectangle |
| Ellipse | User-drawn ellipse |
| Polygon | User-drawn polygon |
| Auto | Detected shape, whether detected using Threshold Detection or Auto Detection |
Morphology Analysis Workflow
Morphology analysis in Image Studio refers to a collection of flexible tools for identifying shapes in an image, counting shapes, and making morphological measurements of the shapes.
The Morphology Analysis in Image Studio can be used for a variety of assays and measurements, so the information in this topic is intended only as starting points to show how the tools in the Morphological Analysis can be used.
If you are new to morphological analysis, please consider starting with the concepts and further reading links in the Morphology Analysis Concepts topic.
Generalized Workflow
Morphology analysis is generally comprised in phases, with tools for each phase provided from left to right on the Morphology Analysis ribbon.
Phase 1: Define the Part(s) of the Image to Analyze
Often, a scan will have artifacts that do not need to be analyzed and/or may contain multiple samples. If you do not want to analyze an entire image, you have multiple options for defining a smaller image or area for analysis.
-
Crop the image - You can use the Image ribbon > Crop option to crop images into separate acquisitions for analysis.
-
Define areas of interest on the image - Standard shape drawing tools are included in the Morphology Analysis ribbon for drawing elliptical, rectangular, or freehand Areas of Interest (AOI). AOIs can also be generated automatically with tools described below. When toggled appropriately, regions inside an AOI will be included (called an "inclusion AOI") or will not be included (called an "exclusion AOI") when finding shapes. Not using an AOI shape will simply include the full image.
Phase 2: Generate Shapes
The following instructions show two options for generating shapes. (If needed, generated shapes can be made into inclusion or exclusion AOIs as described in the prior phase.)
-
In the Display panel, display only one channel.
Generally, it is a best practice to adjust the Lookup Table Sliders to be the same for all images with a given channel in an experimental set, but needs can vary based on experimental details.
-
There are currently two options for how to generate shapes.
-
Option 1: Manually set an upper and/or lower threshold pixel intensity using the a Custom Threshold analysis. In this workflow, you will inspect the image to find the upper and/or lower pixel intensity threshold that separates the features you want to analyze from the image background. You will use these thresholds to create an image mask, and contours will be generated around the features based on the mask. If needed, Opening and Closing parameters can be used to refine feature detection.
-
Option 2: Generate shapes based on adaptively determined thresholds using Auto Detection. This method will subtract background noise based on the Erosion Size or Subtraction Constant (typically only one is used, although it is possible to use both in conjunction), then use Otsu's method to find a threshold for each square tile of the size indicated in Threshold Neighborhood. Setting the Threshold Neighborhood to the size of the greatest dimension of the image is effectively equivalent to using a simple automatic threshold detection.
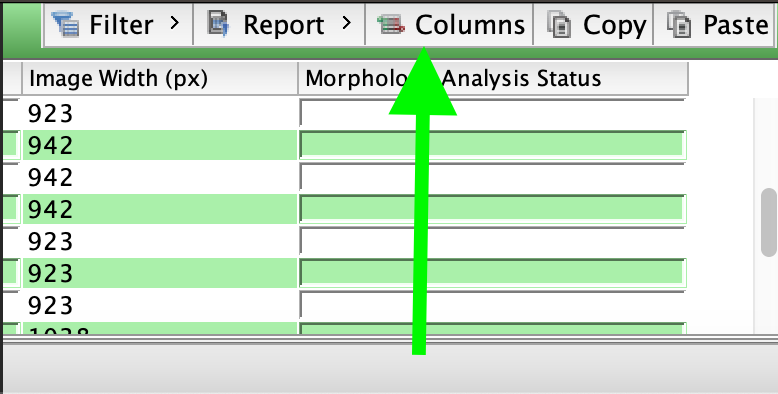
Tip: You can easily view the height and width of the image by adding columns to the Morphology Shapes table. Click Columns above the Morphology Shapes table and select Image Height (px) and Image Width (px) to add those columns to the Morphology Shapes table.
-
Phase 3: Refine Generated Shapes (if Needed)
After generating shapes, you may find that the objects are undersegmented, meaning that some objects that should be separate are joined. To account for this, the Refine Shapes group provides the Watershed option. Generally, it is designed to be used with either erosion or distance transform based foreground thresholding, not both. It can mathematically use both, but generally is not done in practice. Eroding the mask, or calculating the distance transform and selecting a smaller portion of it based on a threshold, generate a known foreground. Dilation generates known background locations, and then the valleys between unknown regions are calculated. This operation works on currently showing shapes. This means if run multiple times in a row, the originally found shapes will be run through the watershed algorithm, and subsequent runs will operate on the previous result of the watershed algorithm.
Exporting Data
Click Export Summary Data to export a spreadsheet with the option of having data in physical units (mm, um, and cm) instead of pixels.
Ensure all the necessary columns (listed in the dialog) are in the Morphology Shapes table. If any are missing, click Columns (near the lower right corner of the Image Studio window) and choose the columns to add.
To export physical units instead of pixels, choose the unit you want in the Length list and then click Export Summary Data. Supported physical units are mm, um, and cm. When you are done exporting data, click Close.
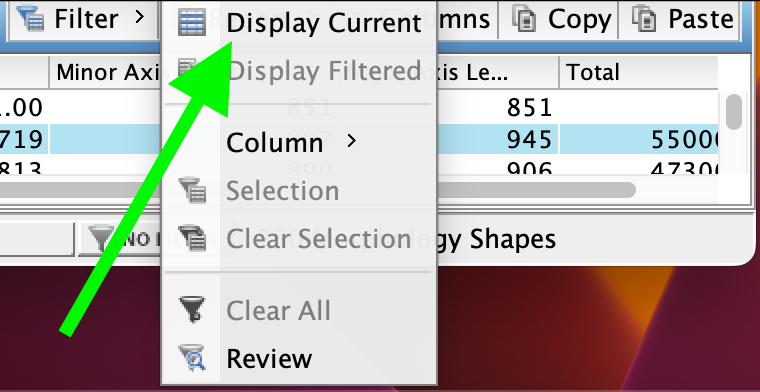
To export data from multiple replicate analyses in a Work Area, click Filter and uncheck Display Current.
Morphology Analysis Examples
Example 1 Measure Area of a Spheroid in a Brightfield Individual Well Image from the LICORbio Atlas™ Imager
This tutorial is an example to show the flexibility of the Morphology Analysis tools. Your analysis will need to be adjusted to meet the needs of your research.
| Goal | The goal of this analysis is to measure the Area of a spheroid. |
| Inputs | A brightfield image (630 Trans) was acquired of an individual well from a 96-well plate at 5 µm resolution using the LICORbio Atlas™ Imager. |
| Process Overview | This example will identify an area around the spheroid as an Area of Interest (AOI) and then mask the spheroid so that a contour can be drawn around the spheroid and the spheroid's Area can be measured. |
-
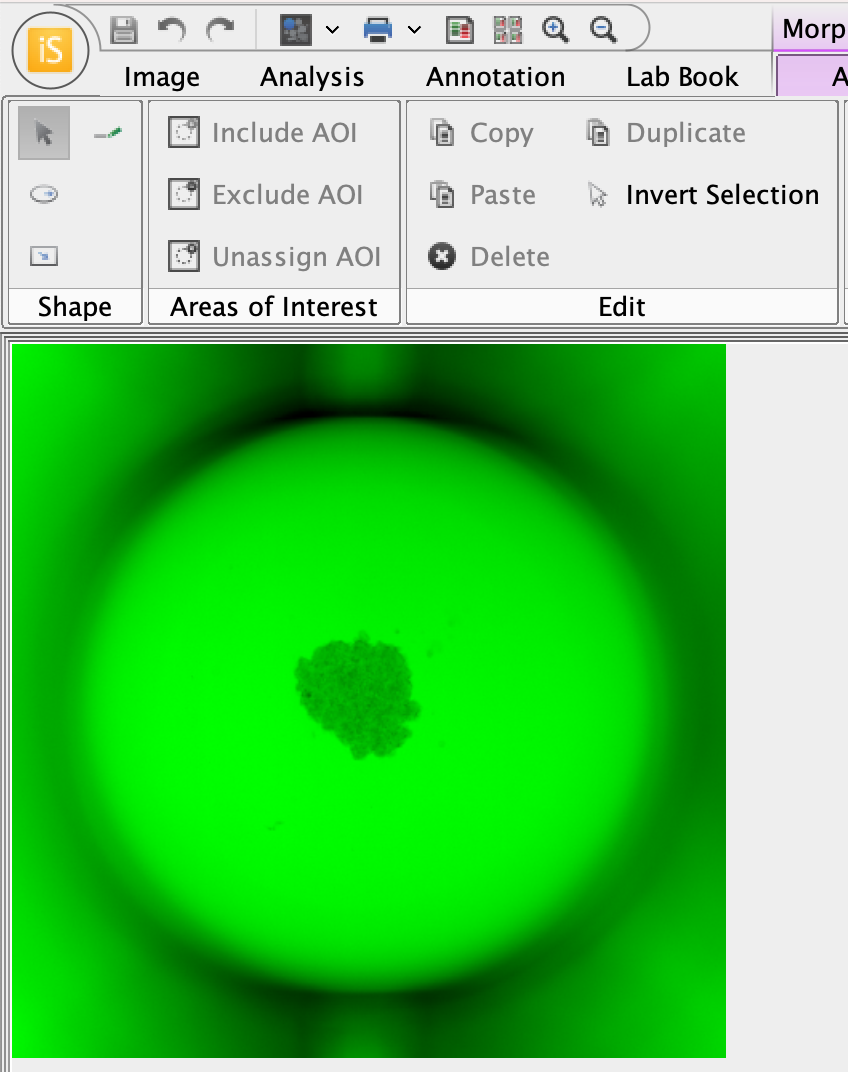
In the Display panel, choose a bright color that can be seen easily.
The image mask pixels are gray. It will help to be able to visually contrast the areas indicated by the image mask against the original image.
The well image in a bright color will look something like this.
-
Apply a Morphology Analysis (Analysis ribbon > Manual > Morphology).
-
In Morphology Analysis > Shape group, click Draw Ellipse.
You will draw an ellipse around the spheroid to use as an Area of Interest. The Area of Interest will limit where shapes are found in the image to limit unneeded objects from being detected.
-
To draw a circle around the spheroid, click into the center of the spheroid, then left-click and drag the cursor away from the spheroid until the circle encompasses the spheroid.
If you want to draw a perfect circle around the spheroid, hold down the SHIFT key while clicking and dragging the cursor.
-
To exit drawing mode, press ESC or click Select in the Morphology Analysis ribbon.
-
With the ellipse you just drew selected, click Include AOI.
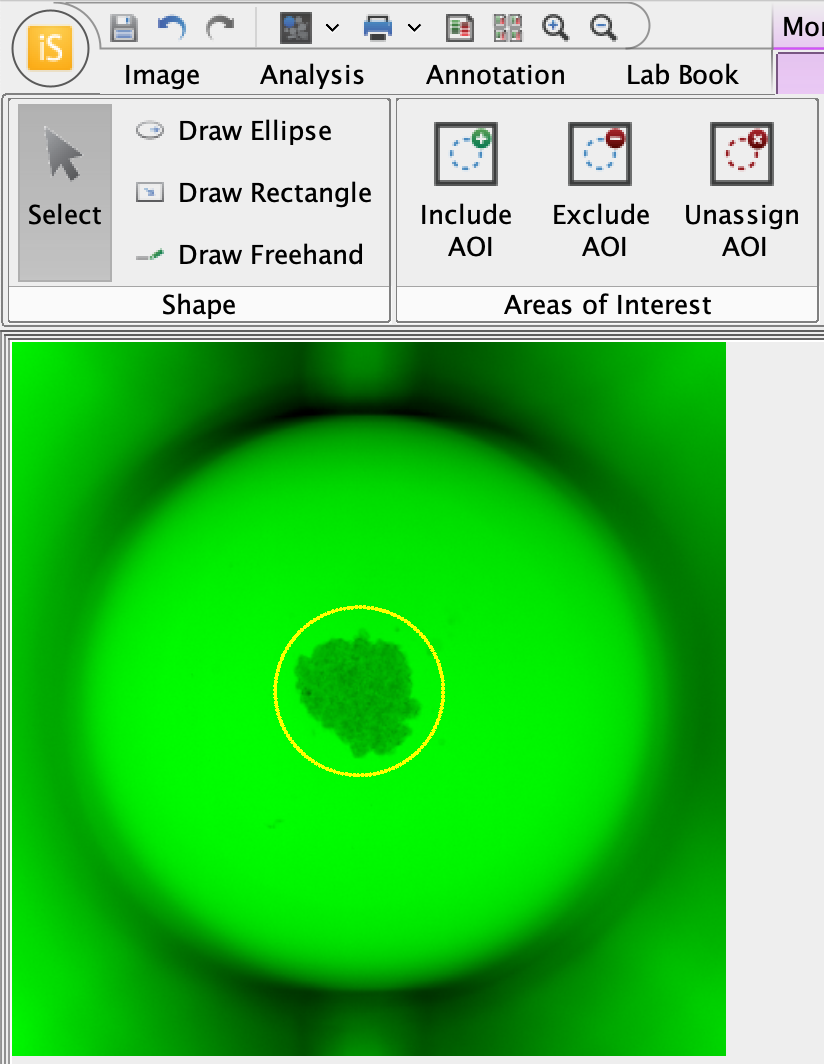
Figure 23. Now that the ellipse around the spheroid is assigned as an AOI, only objects within the ellipse (i.e., the spheroid in this example) will be detected. -
You will need to determine which pixel intensity to use as the threshold to mask the spheroid. Point your cursor to the center of the spheroid and notice that the pixel intensity at the location of your cursor is shown in the lower right of the Image Studio window.The pixel intensity changes as you move your cursor.
Find a representative pixel intensity for within the spheroid. This will be a starting point for setting the mask threshold.
Figure 24. The pixel intensity is shown in the lower right corner of the Image Studio window. The pixel intensity text is shown in the same color as the display color for the image channel. -
In the Custom Thresholds group, click Threshold Detection.
-
In the Threshold Detection dialog, enter a pixel value in the text field for the Upper threshold or adjust the Upper threshold slider. Continue adjusting until the gray pixels of the mask cover the spheroid inside the AOI.
Especially for clear walled plates, there may be regions outside the AOI that are also included in the mask, but regions outside the AOI will not be detected.
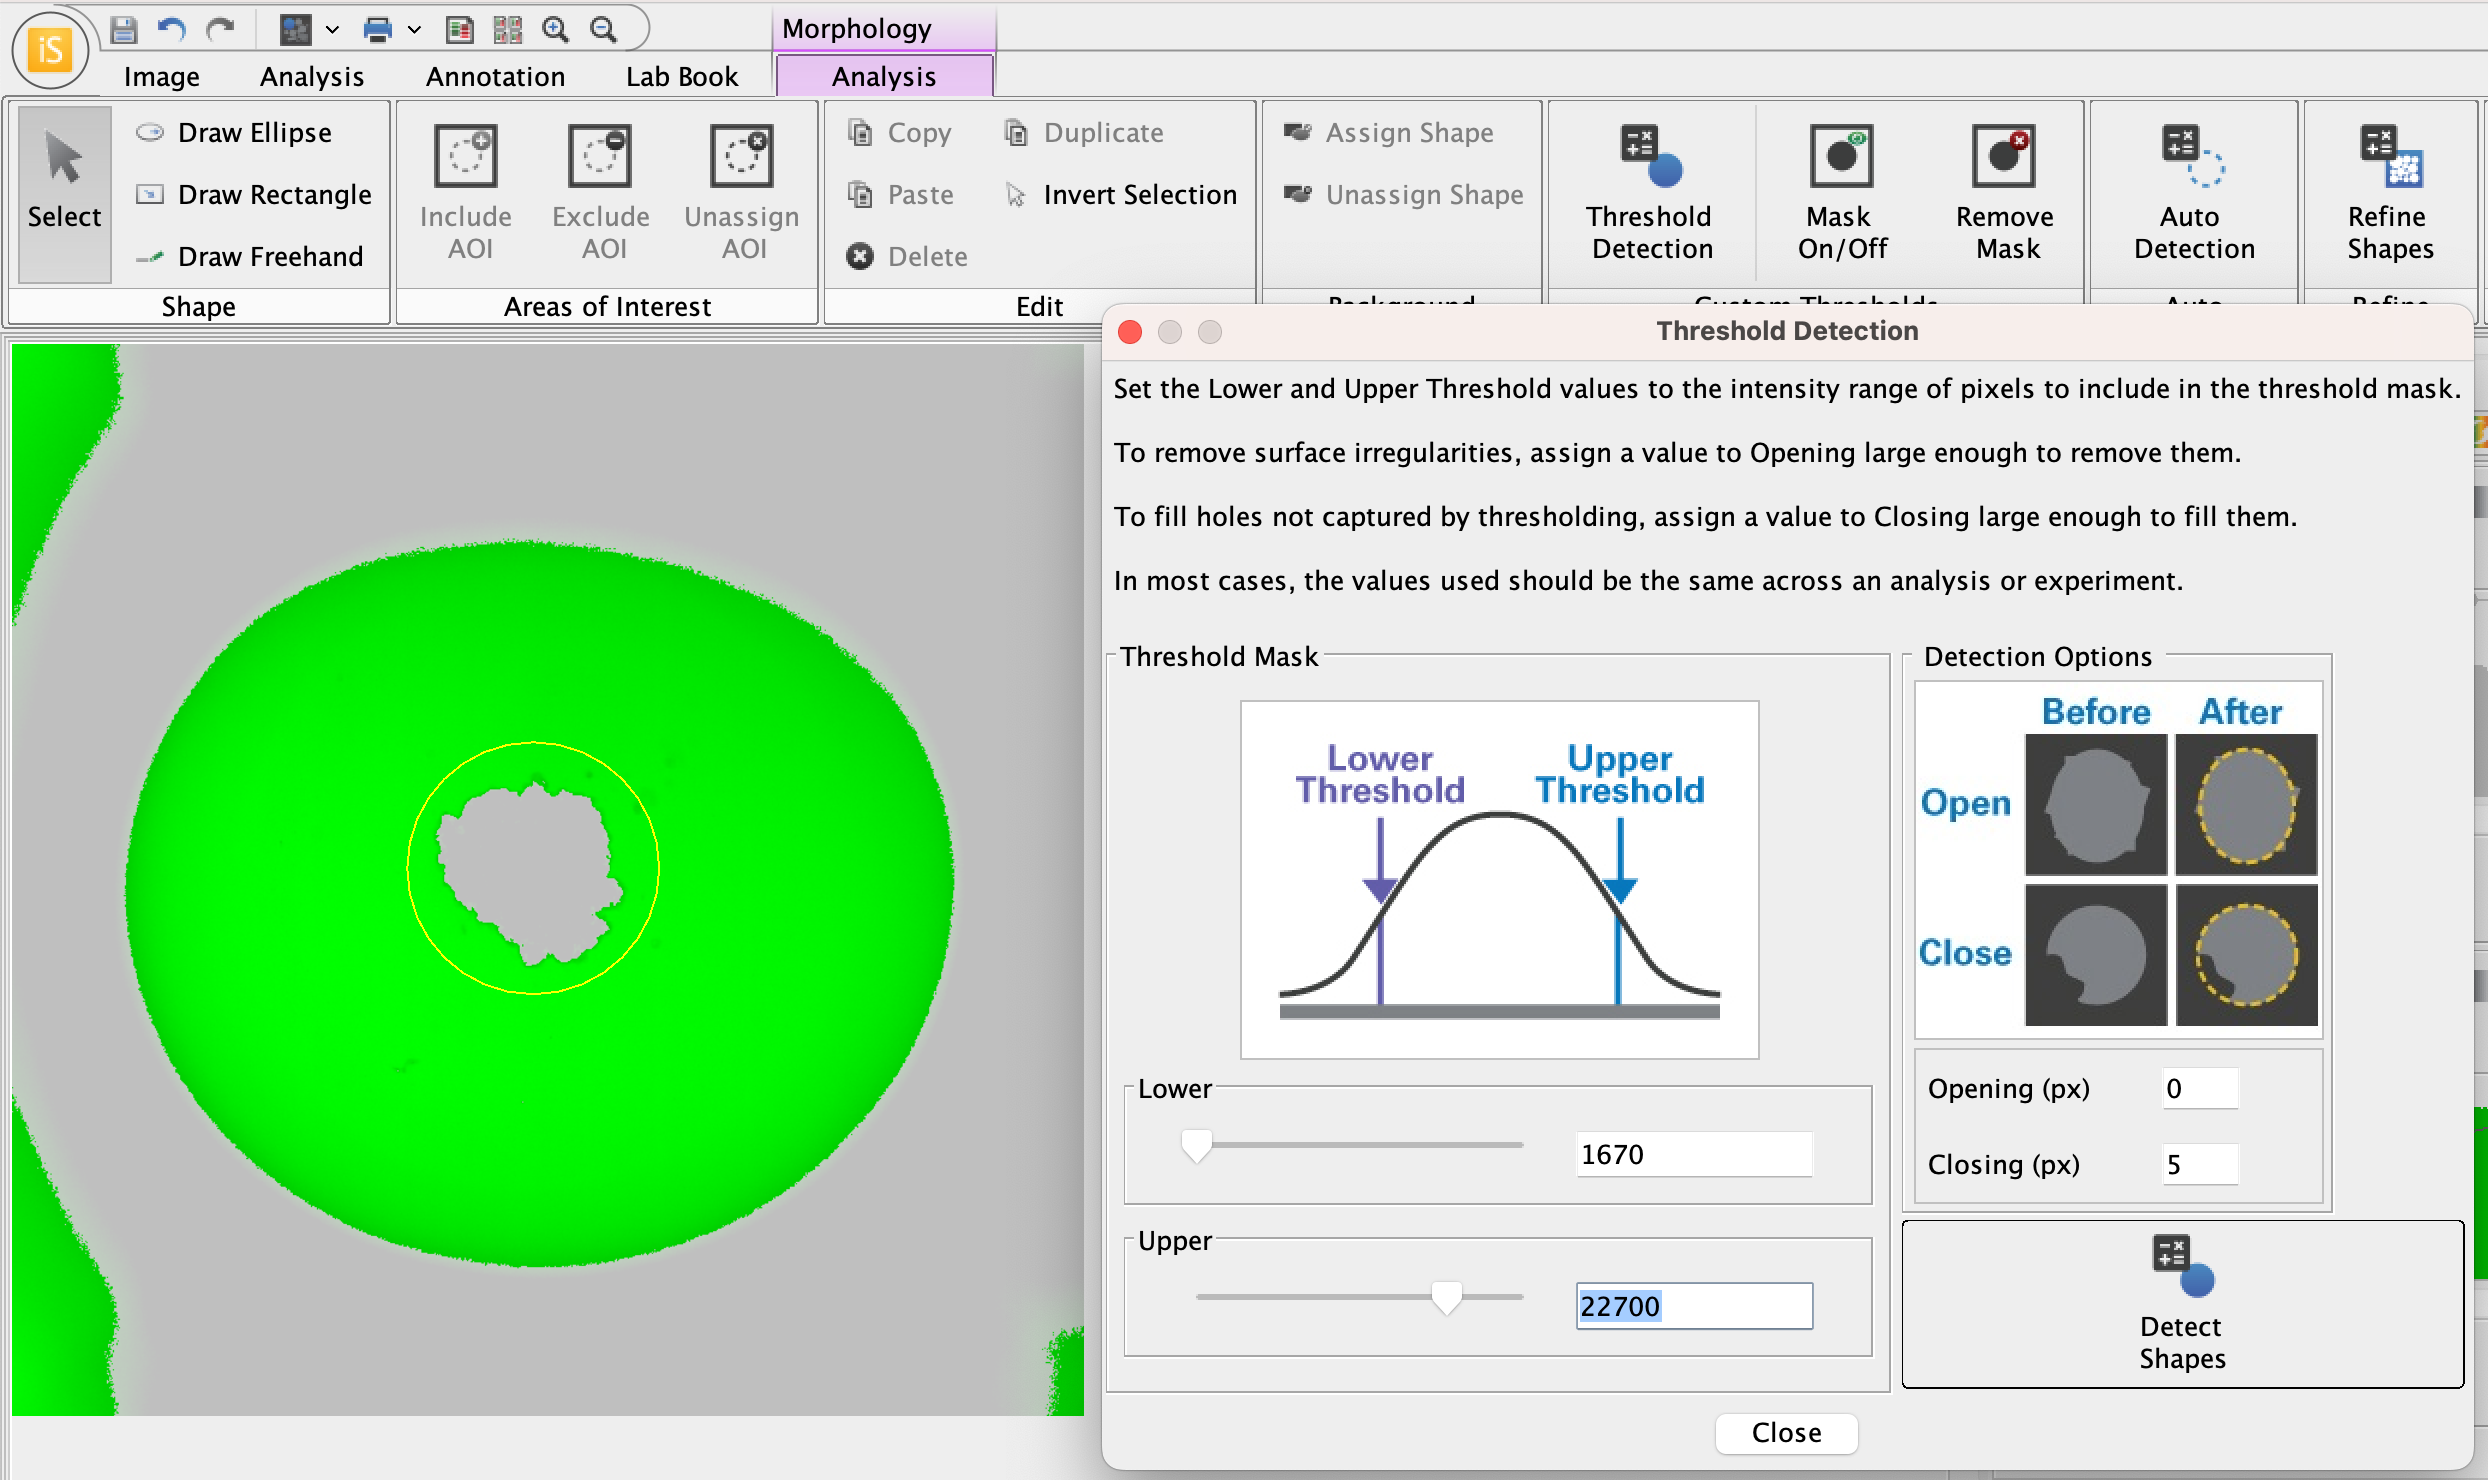
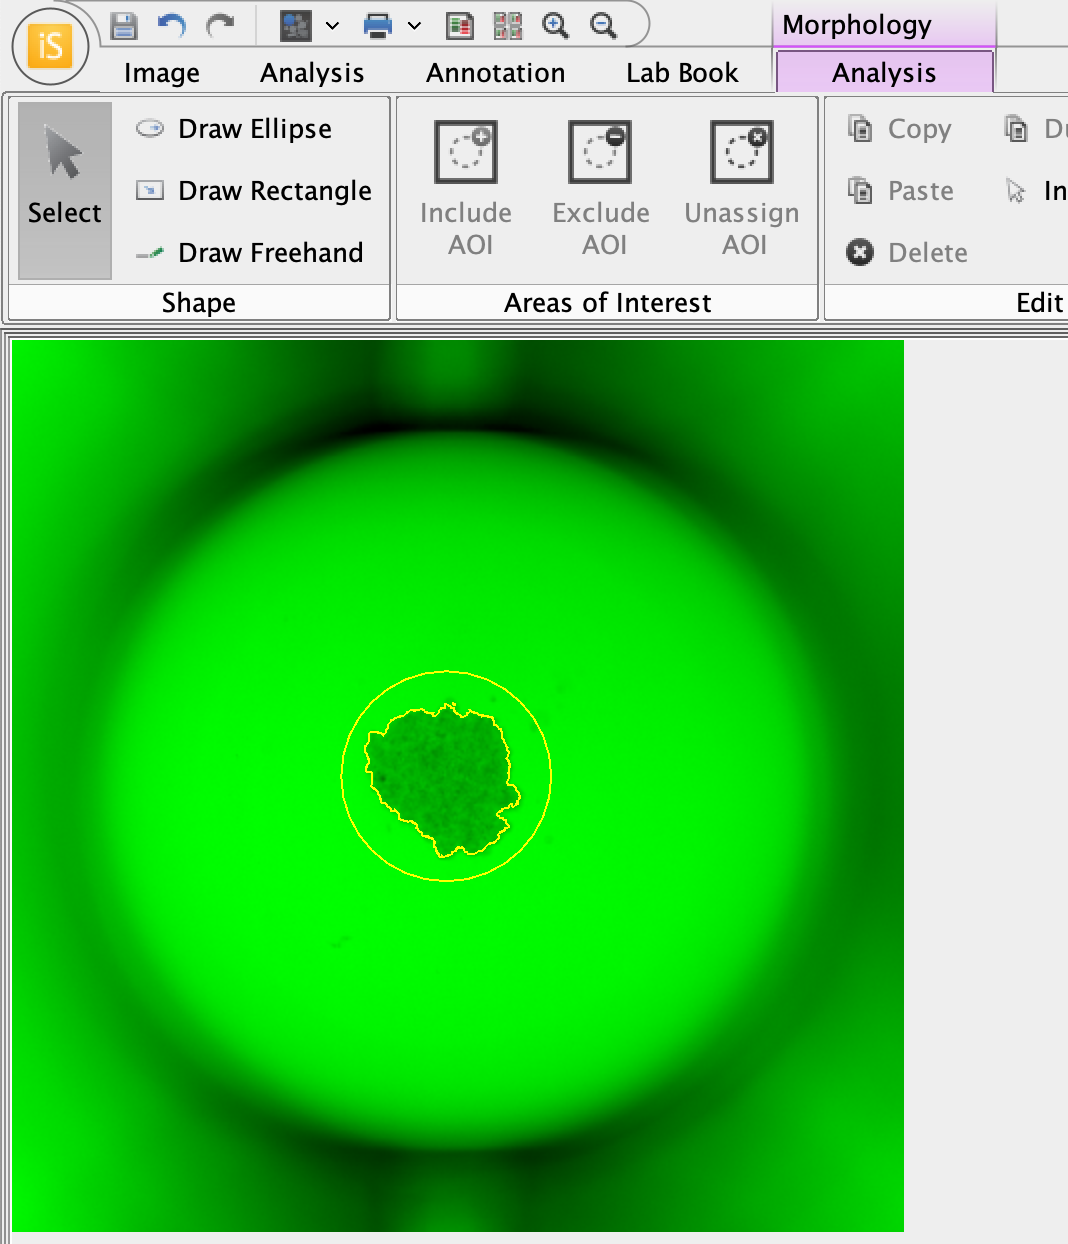
Figure 25. Now that the ellipse around the spheroid is assigned as an AOI, only objects within the ellipse (i.e., the spheroid in this example) will be detected. -
Once the mask covers the spheroid, click Detect Shapes in the Threshold Detection dialog. The spheroid with a contour drawn around it will look something like this.
-
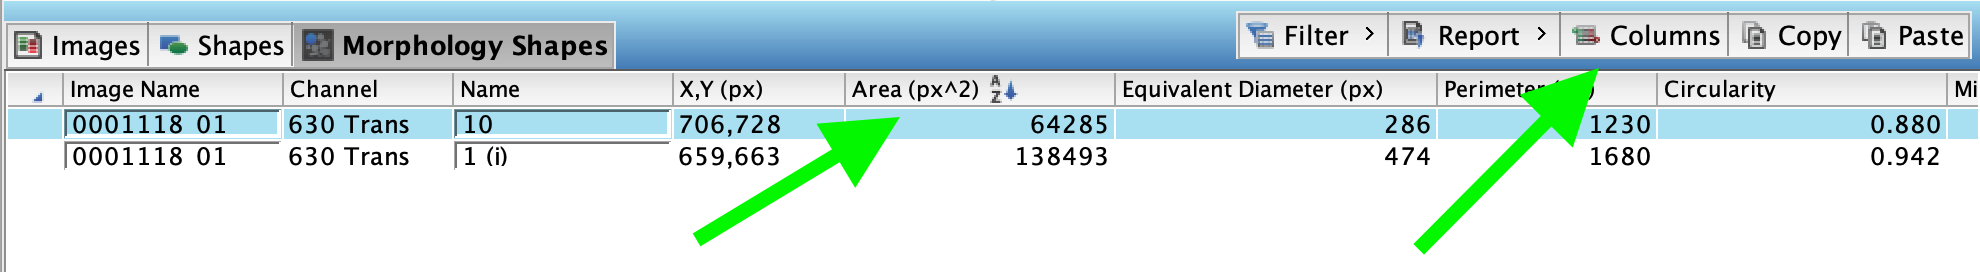
In the Morphology Shapes table, notice that the Area is shown in pixels.
-
If there are extra, unneeded shapes, you can delete them or filter them out of the table according to the criteria needed for your analysis. Right click table headers for filter options.
-
Click Columns to view additional measurements that are available to add to the Morphology Shapes table.
-
Click Export Summary Data in the Morphology Analysis ribbon to export Area in length units (µm, mm, cm).
-